 “Search, Analyse, Trade” is a series of Price Action and Elliott Waves analyses. Its detailed step-by-step description can be found over here. I invite you to today’s review of selected currency pairs and potential trading opportunities. The analyses are based on the Dukascopy sentiment that you can get here.
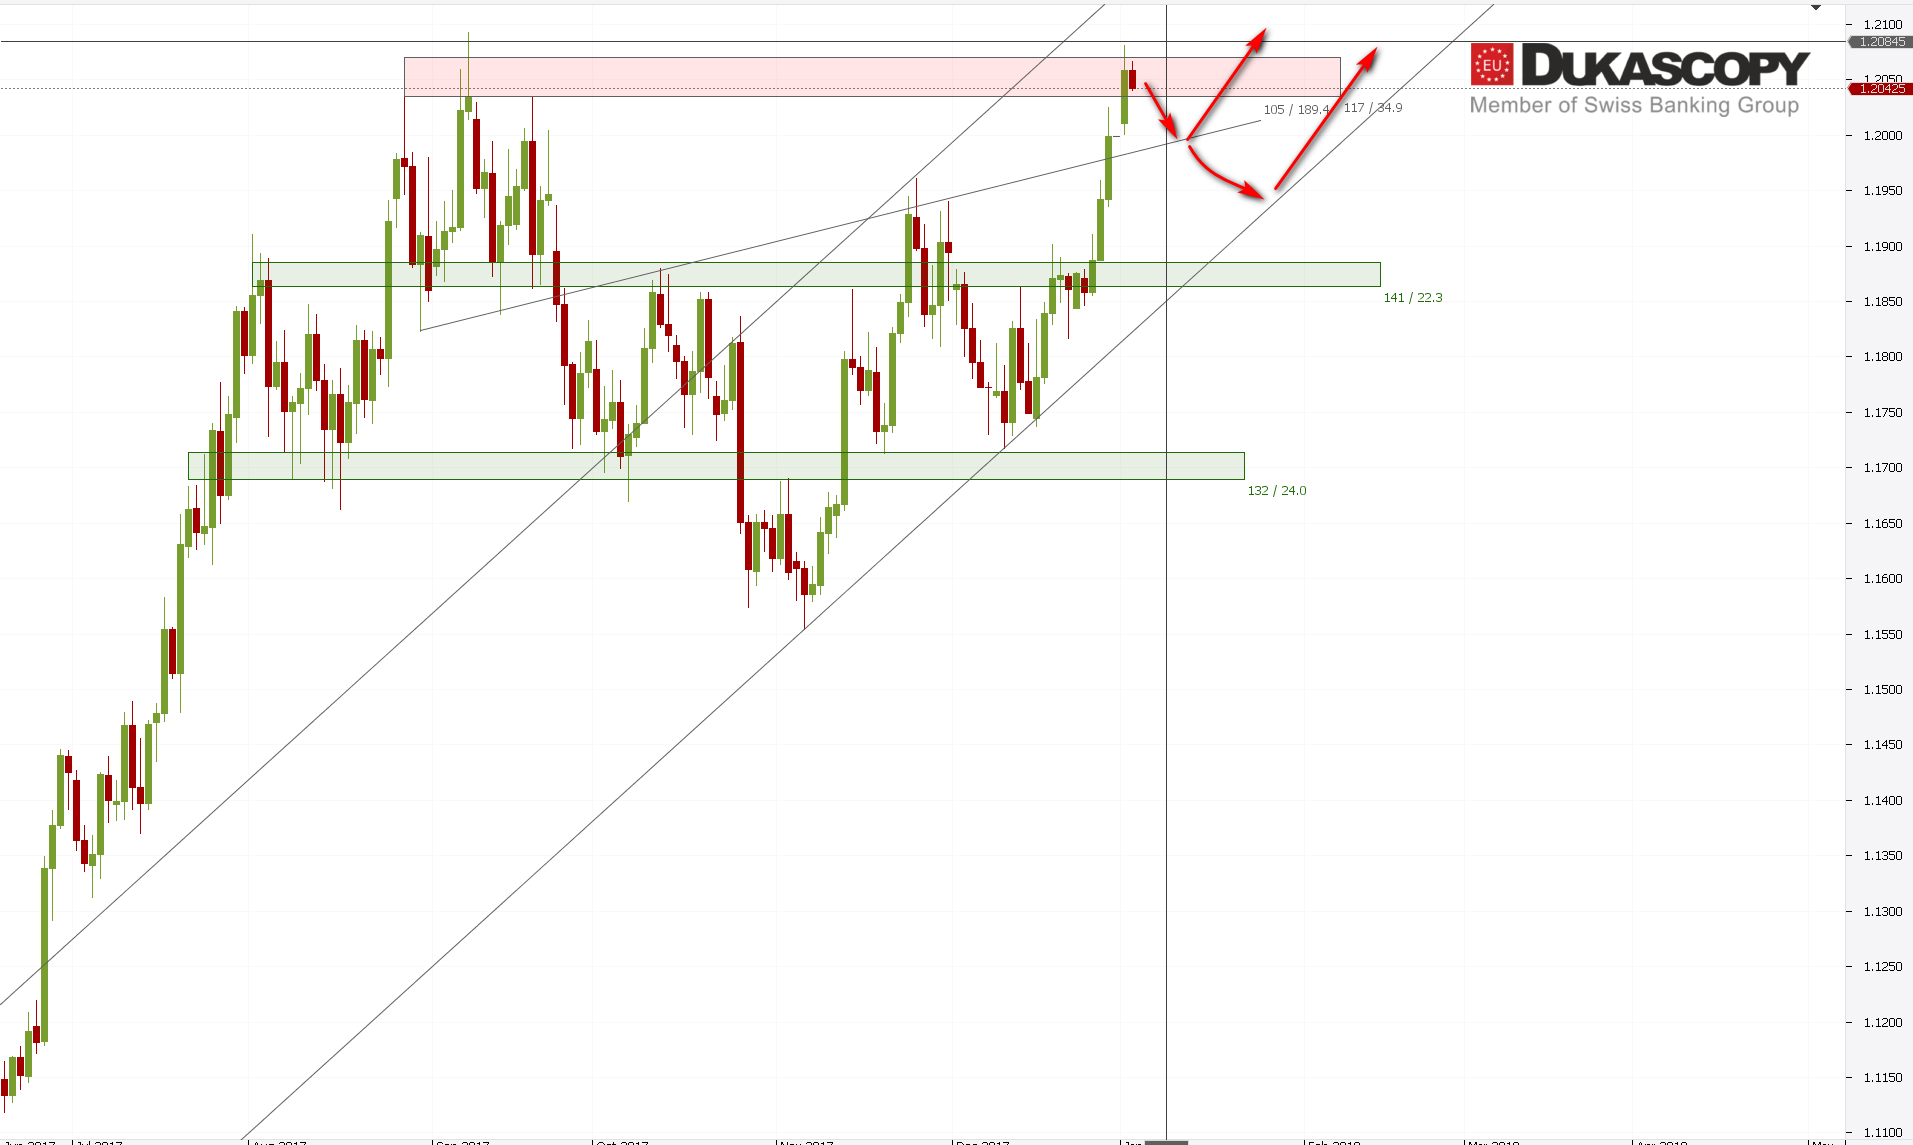 EUR/USD pair firmly broken the local resistance zone around the level 1.1940 and reached a very important resistance zone. We see a supply reaction that can lead to a re-test of at least an internal support line. The current upward wave creates an impulse to the end of which is missing the fifth subwave. The creation of such a wave will mean another attempt to attack the key resistance. The entire system can then be marked as ABC where A = C. Strong upward movement and overcoming the supply zone will mean creation of the third wave and the continuation of increases towards the level 1.2300.
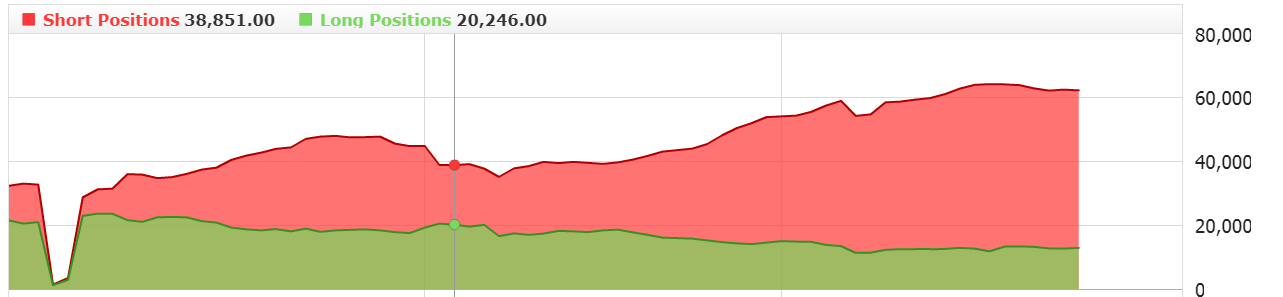 All the strong growth that we have been watching for several days has been used to open short positions or their averaging. Since I will now use the Ichimoku indicator to open the position, which is in line with the trend, the current sentiment attitude makes me stay aside. Morning analysis will be combined with the evening ones in which I will play on the basis of this indicator and check whether the sentiment in some way is able to affect the results of such a game.
The partner of “Search, Analyse, Trade” series is a Dukascopy Europe broker who gives its customers access to ECN accounts in different currencies.
Trade on Forex, indices and commodities thanks to Swiss FX & CFD Marketplace. Open free trading account right now.
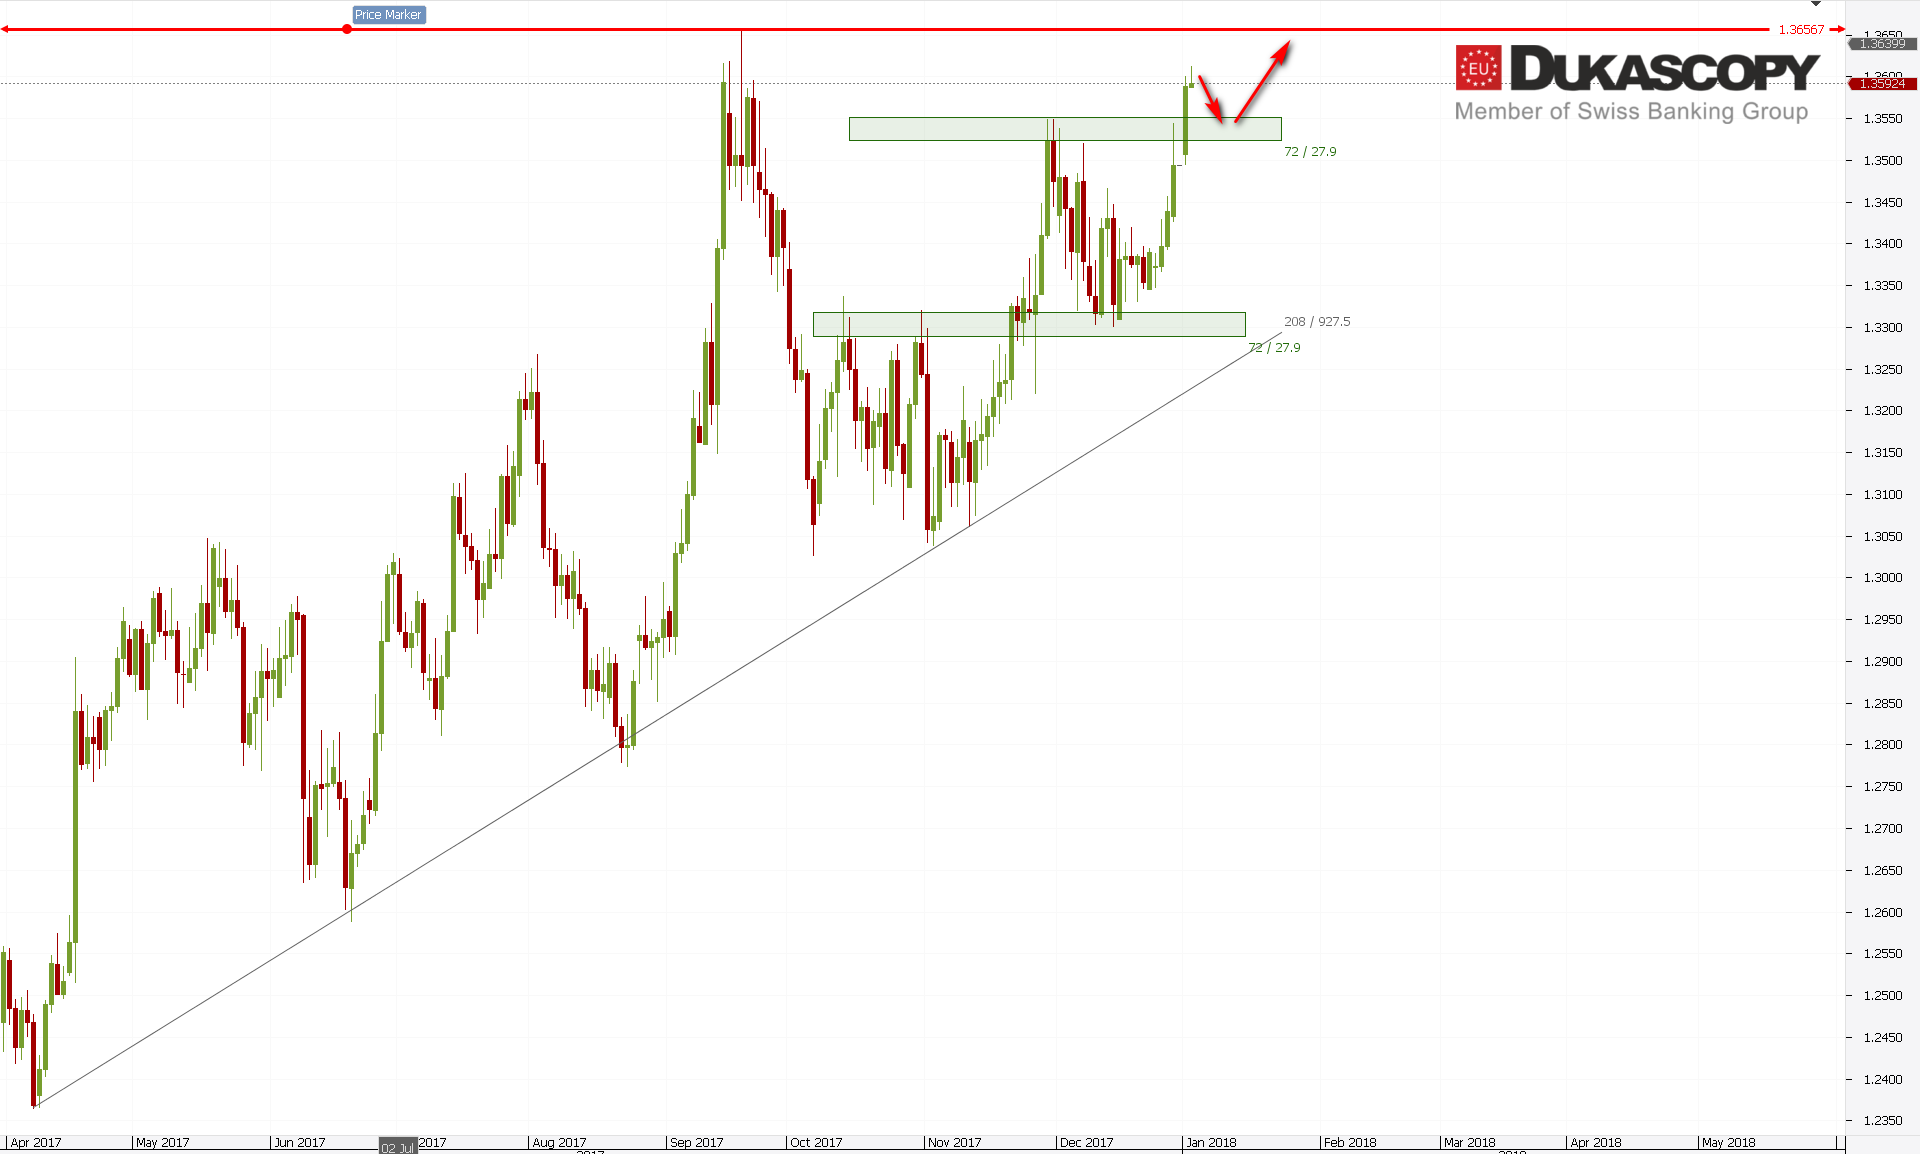
GBP/USD overcame local resistance and approaches the key resistance zone. Its permanent defeat will be the closure of the gap that was created in June 2016 and will open the way to continue growth towards 1.3900. Currently, we can expect a re-test of the level recently beaten and “gathering strength” to attack the key level.
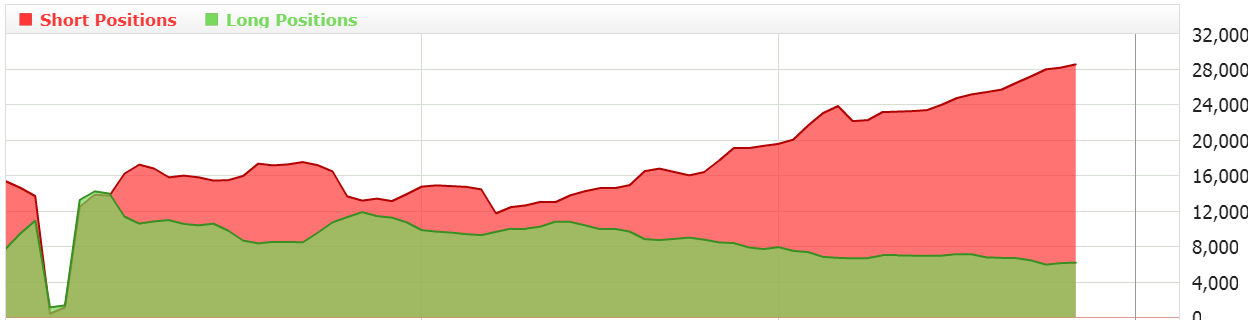
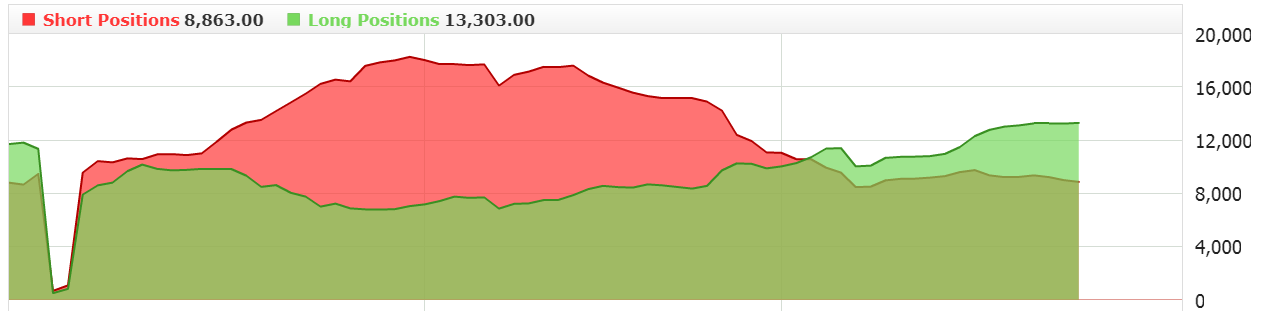
Like in the case of EUR/USD, here also, we see a very strong advantage of short positions. Overcoming the last high will probably involve an escape from these positions and as a result we will see a strong growth impulse. Here, I also stay on the side.
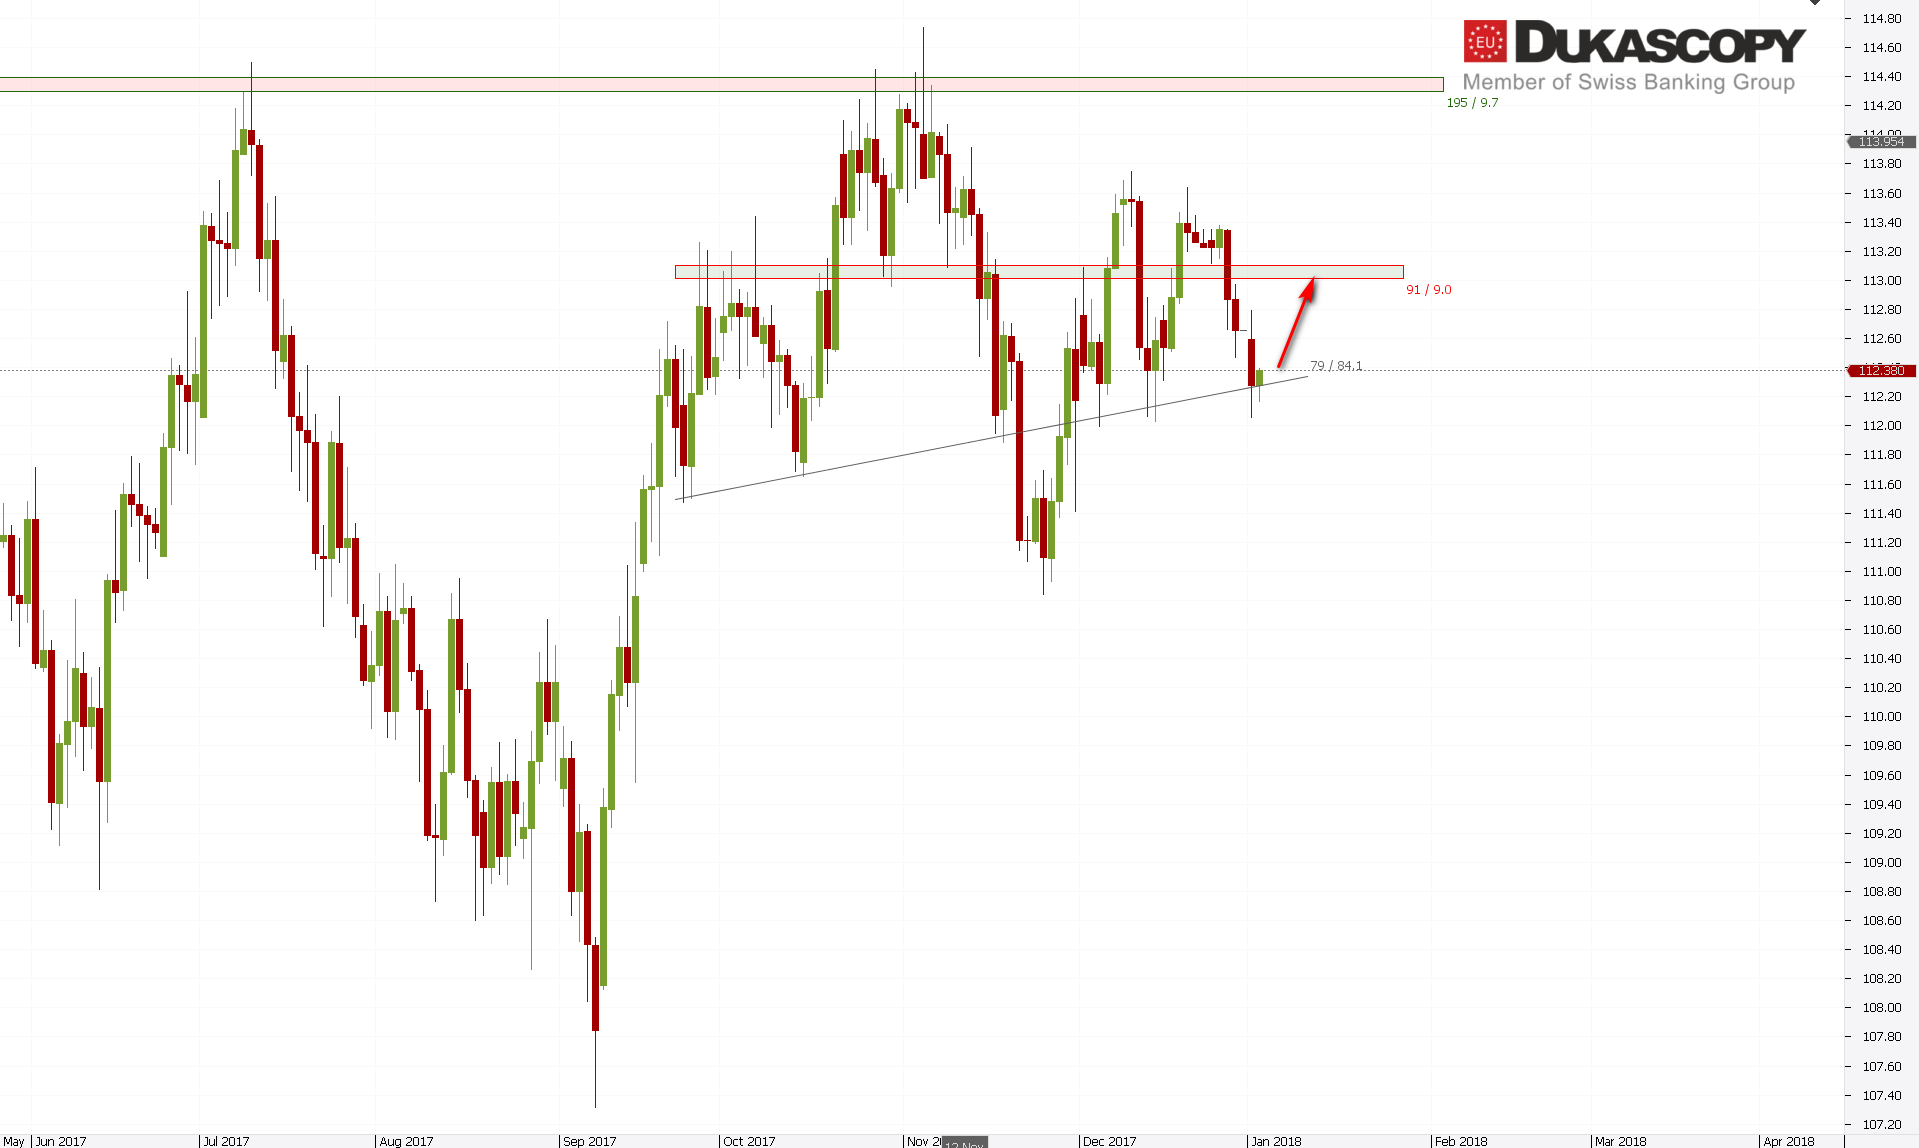 The USD/JPY has arrived at the repeatedly tested internal support line and is trying to reject it. If it works, we should see the movement towards level 113.00. Overcoming the support will be followed by111.80 level test.
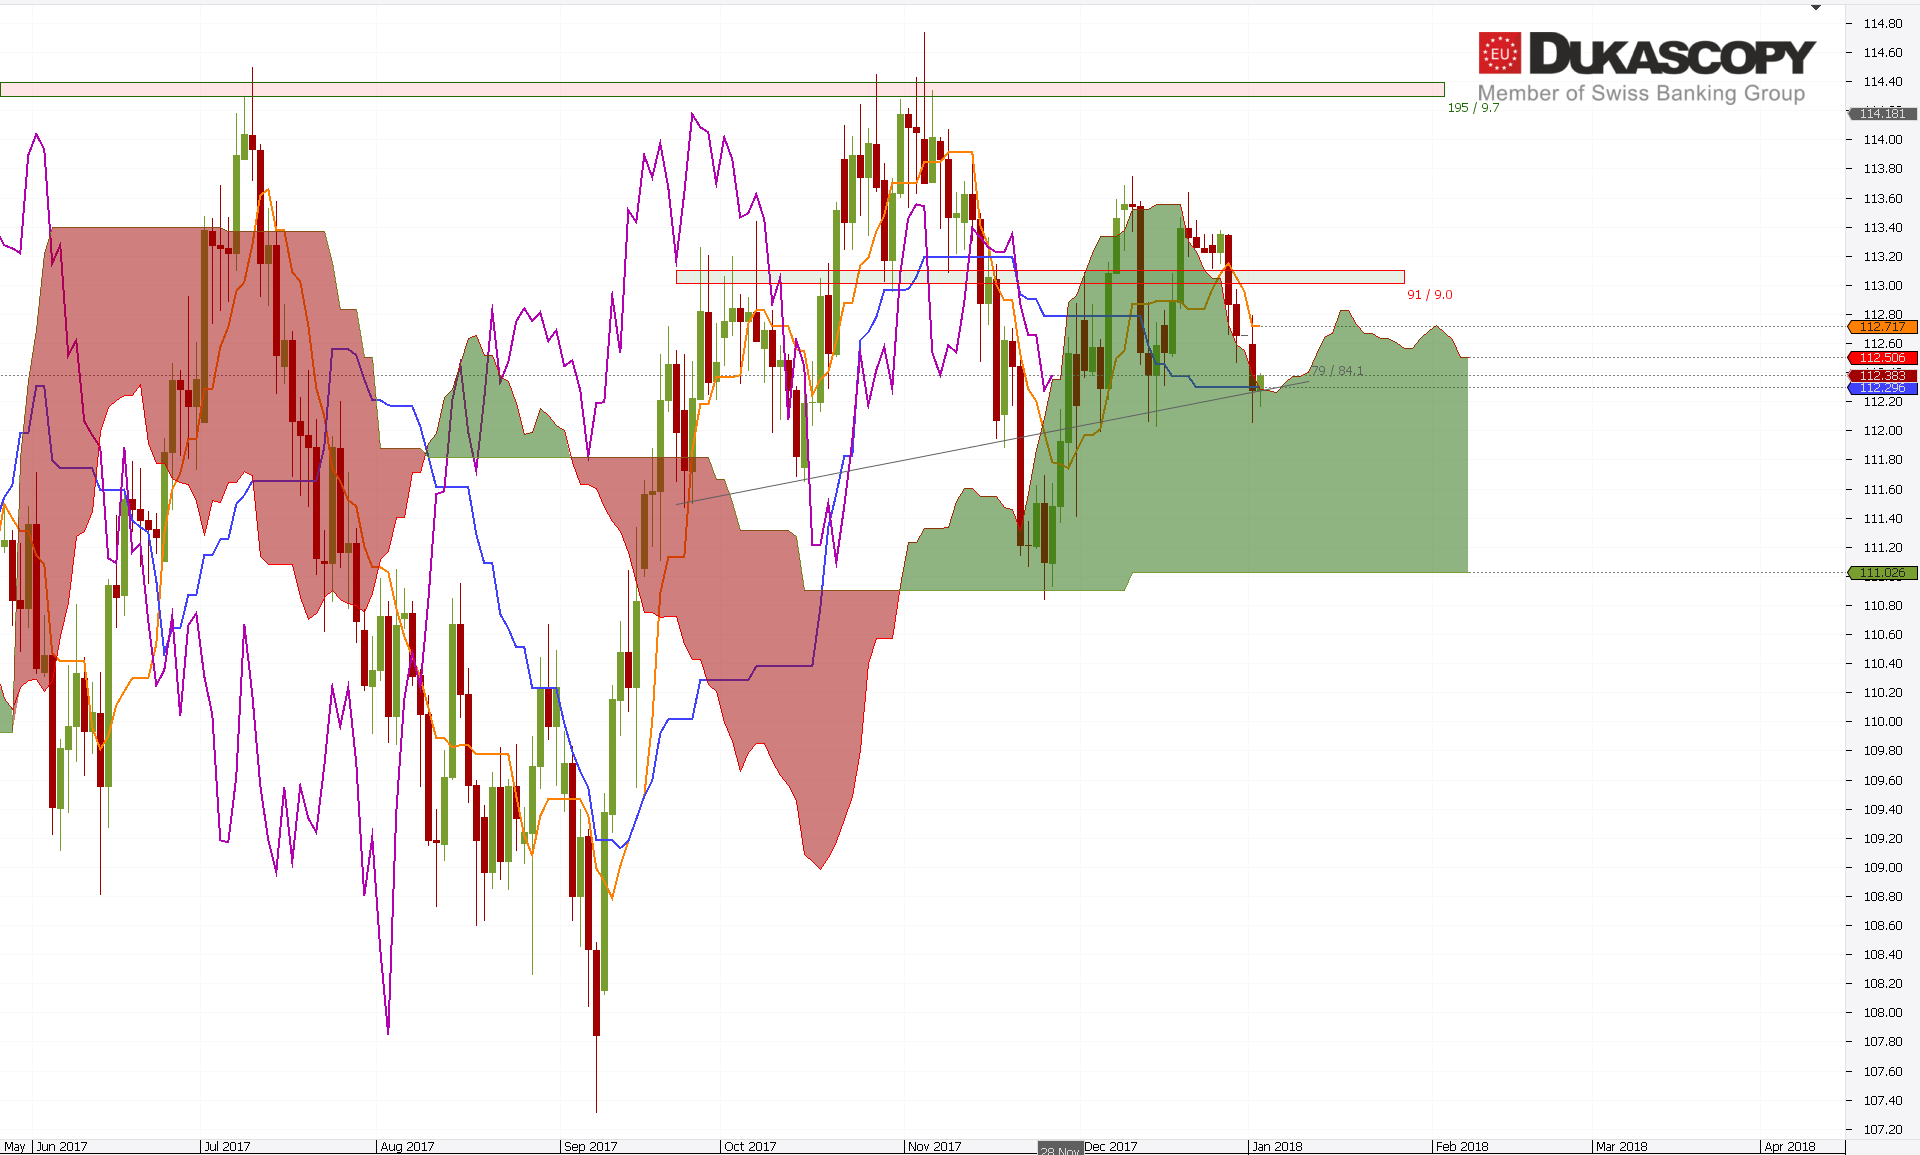 If we look at the graph with the Ichimoku indicator, we will see that the last drops took place on the Senkou Span A line and the Kijun line is being tested. Her defeat may mean a deeper drop even to the lower limit of the clouds.
 In contrast, the sentiment favors opening long positions, so if the pair defends the current levels, I will look for a long position on the H4 chart.


