“Search, Analyse, Trade” is a series of Price Action and Elliott Waves analyses. Its detailed step-by-step description can be found over here. I invite you to today’s review of selected currency pairs and potential trading opportunities. The analyses are based on the Dukascopy sentiment that you can get here.
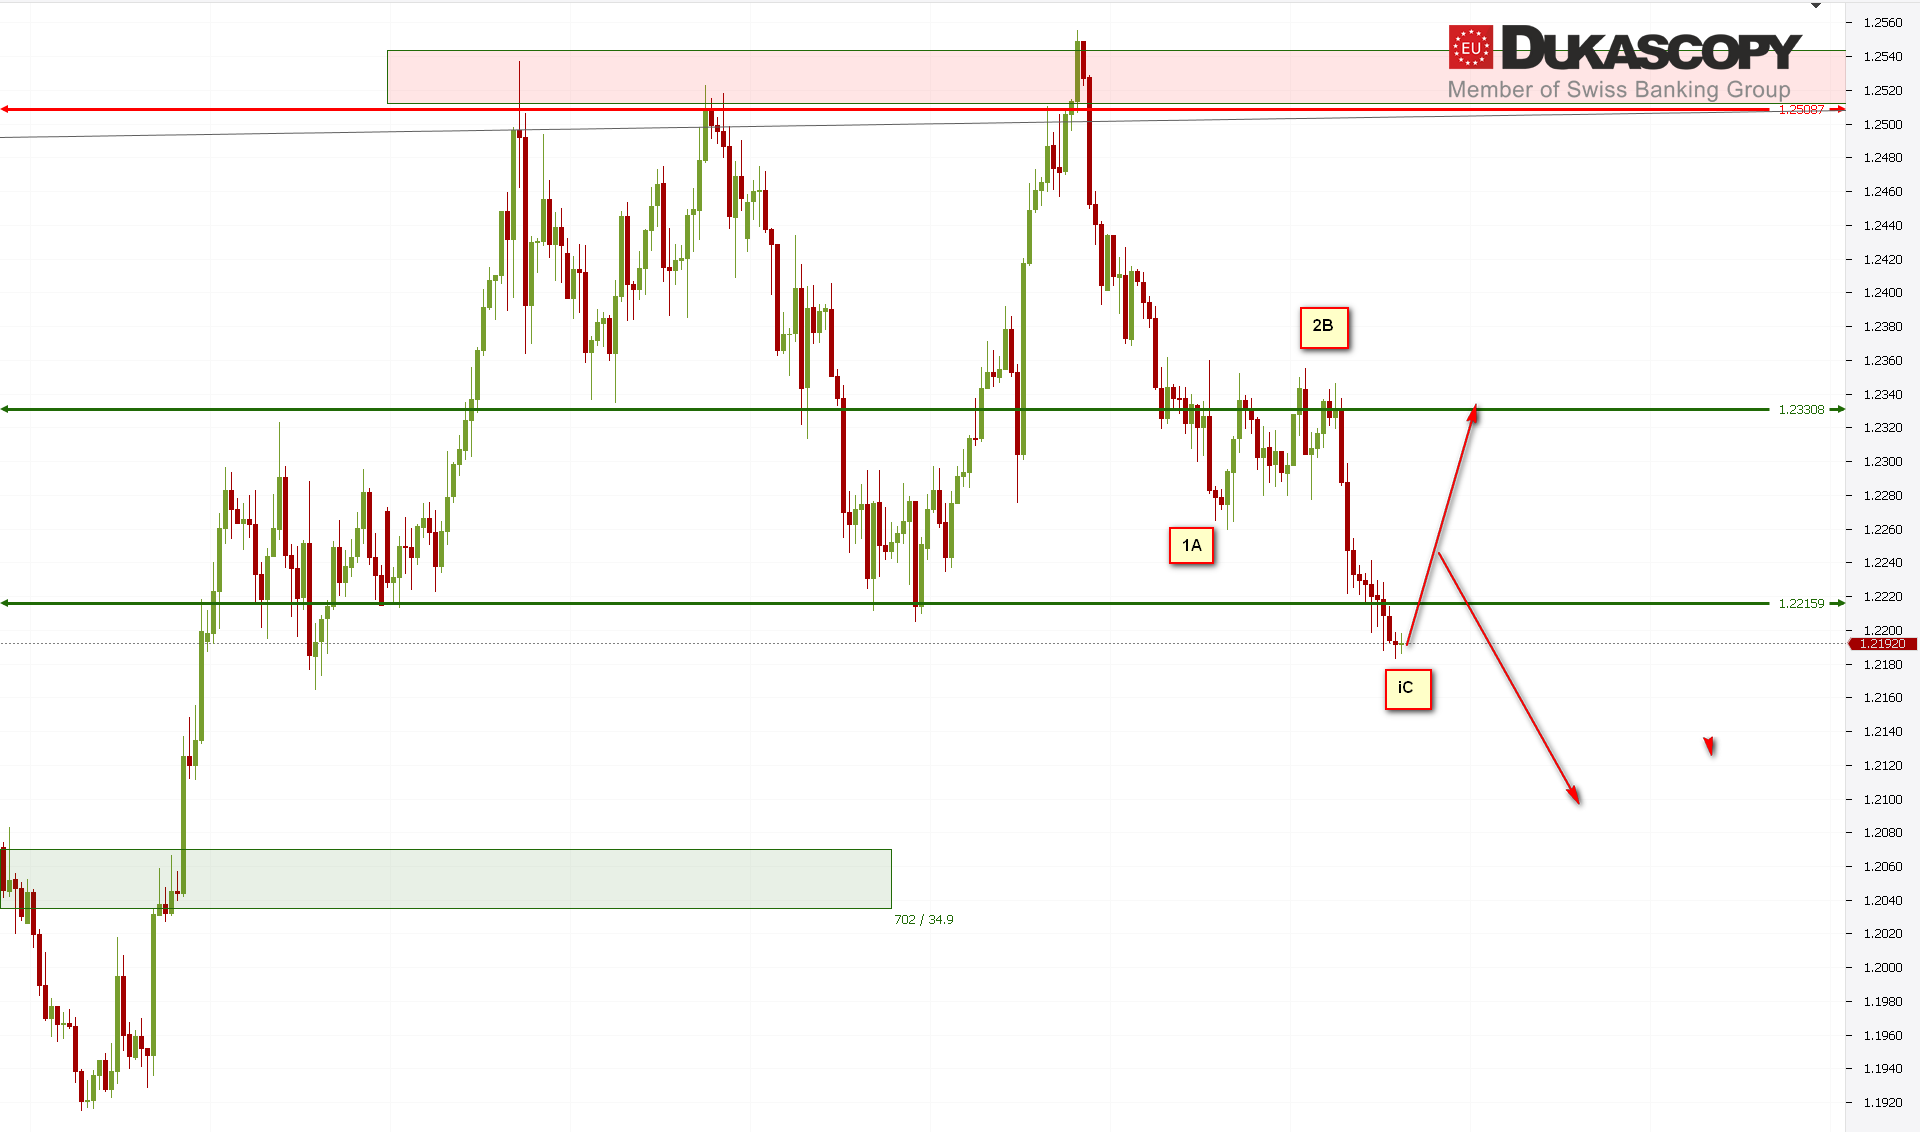
EUR/USD is fighting with lower limitation of the support zone. The last movement that we watch can be written in the simple correction pattern or in 1212. The last bearish wave looks like a five, therefore, we will see defense of the support and completion of the ABC correction, or continuation of declines in the third wave wave 3C. For this, however, it is necessary to overcome the currently tested level.
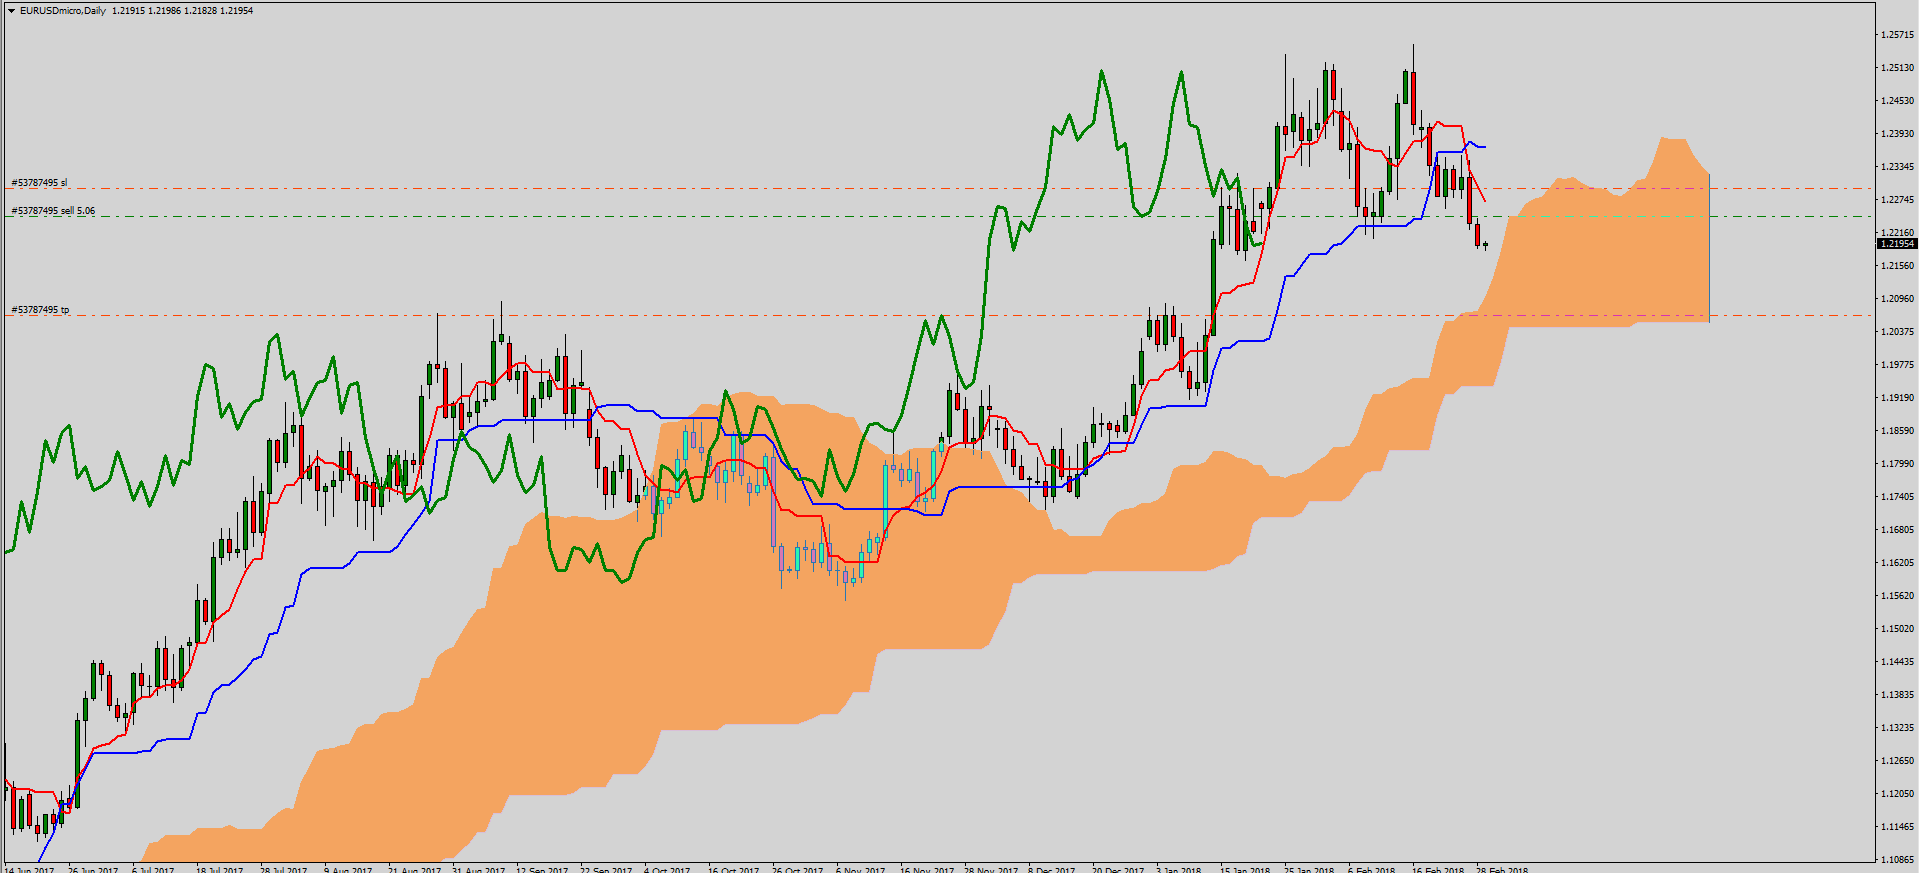 On the Ichimoku chart, we can see that the Chikou line has dealt with the price and reached the Tenkan line, which will support it. Tenkan and Kijun lines cut through giving a weak sell signal. The Tenkan line has been pointing down for a long time, and now the Kijun line is slowly shifting to a downward direction. Moving towards Senkou Span A seems quite possible and further to the flat Senkou Span B, which can attract the price and is on the key support.
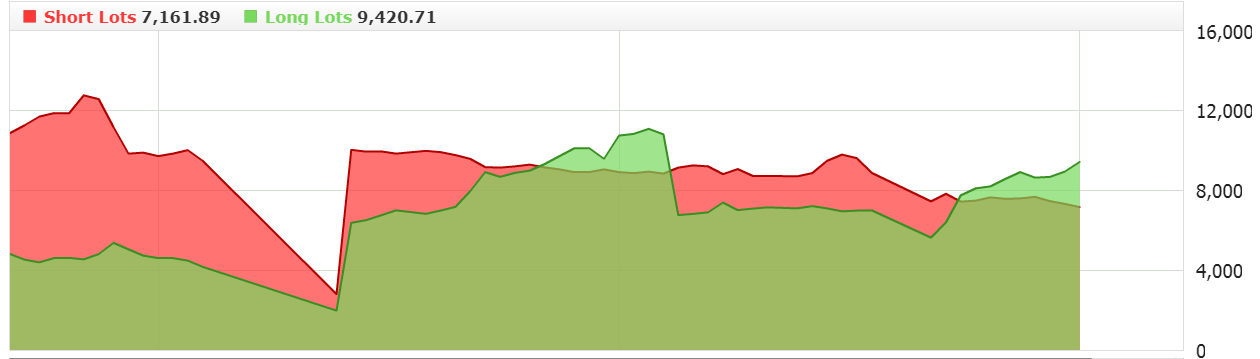 Sentiment changes to bullish. Players count at the end of a simple correction and another upward wave. I have to wait, because Ichimoku does not give me a signal to open a long position.
The partner of “Search, Analyse, Trade” series is a Dukascopy Europe broker who gives its customers access to ECN accounts in different currencies.
Trade on Forex, indices and commodities thanks to Swiss FX & CFD Marketplace. Open free trading account right now.
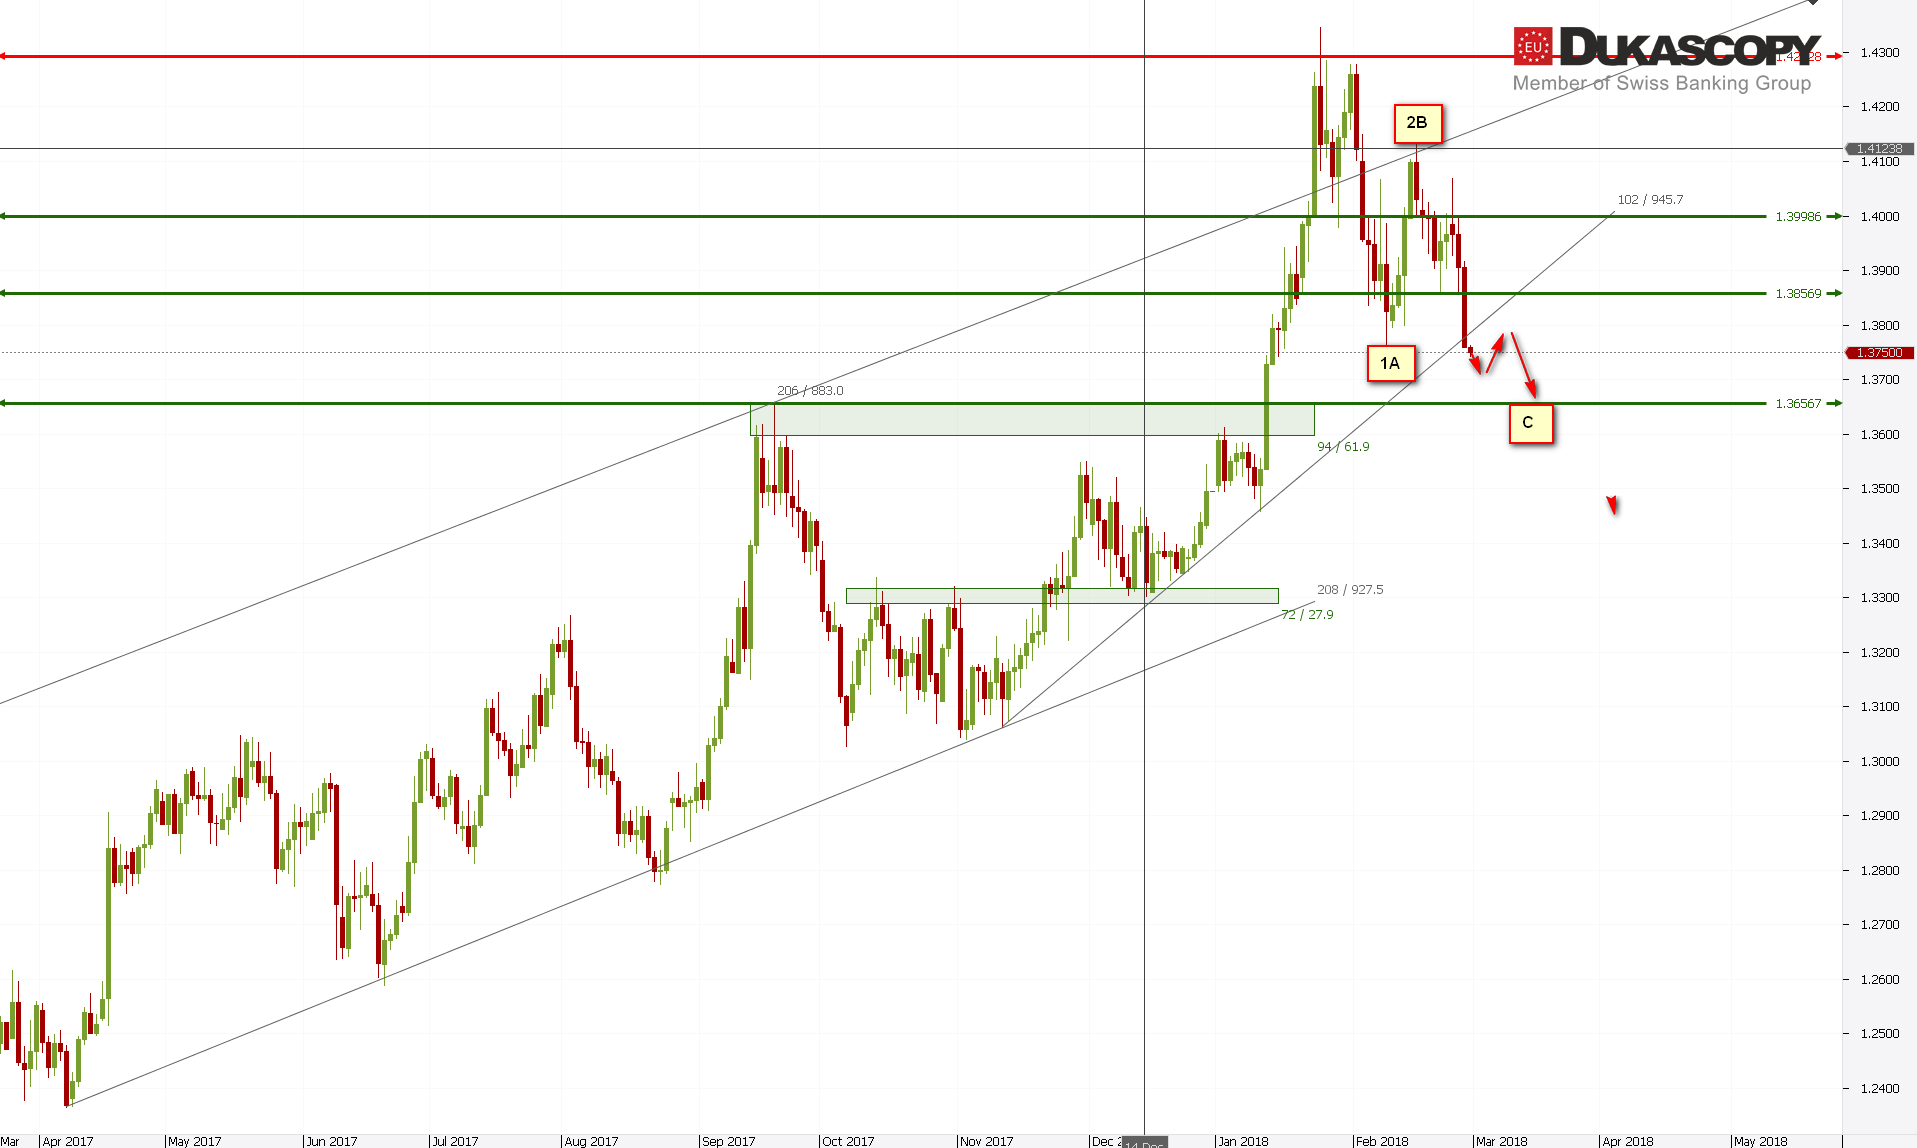 GBP/USD has reached the accelerated trend line and has broken it. The situation with the recent upward wave, which turned out to be a c wave in irregular adjustment, became clear. The current drop should be a 3C wave. The wave is not over, so I’m expecting one more move down towards the important support zone. Only there, it will be decided whether the layout being viewed is a simple correction and after it we will see another upward wave or it is the beginning of a larger downward movement.
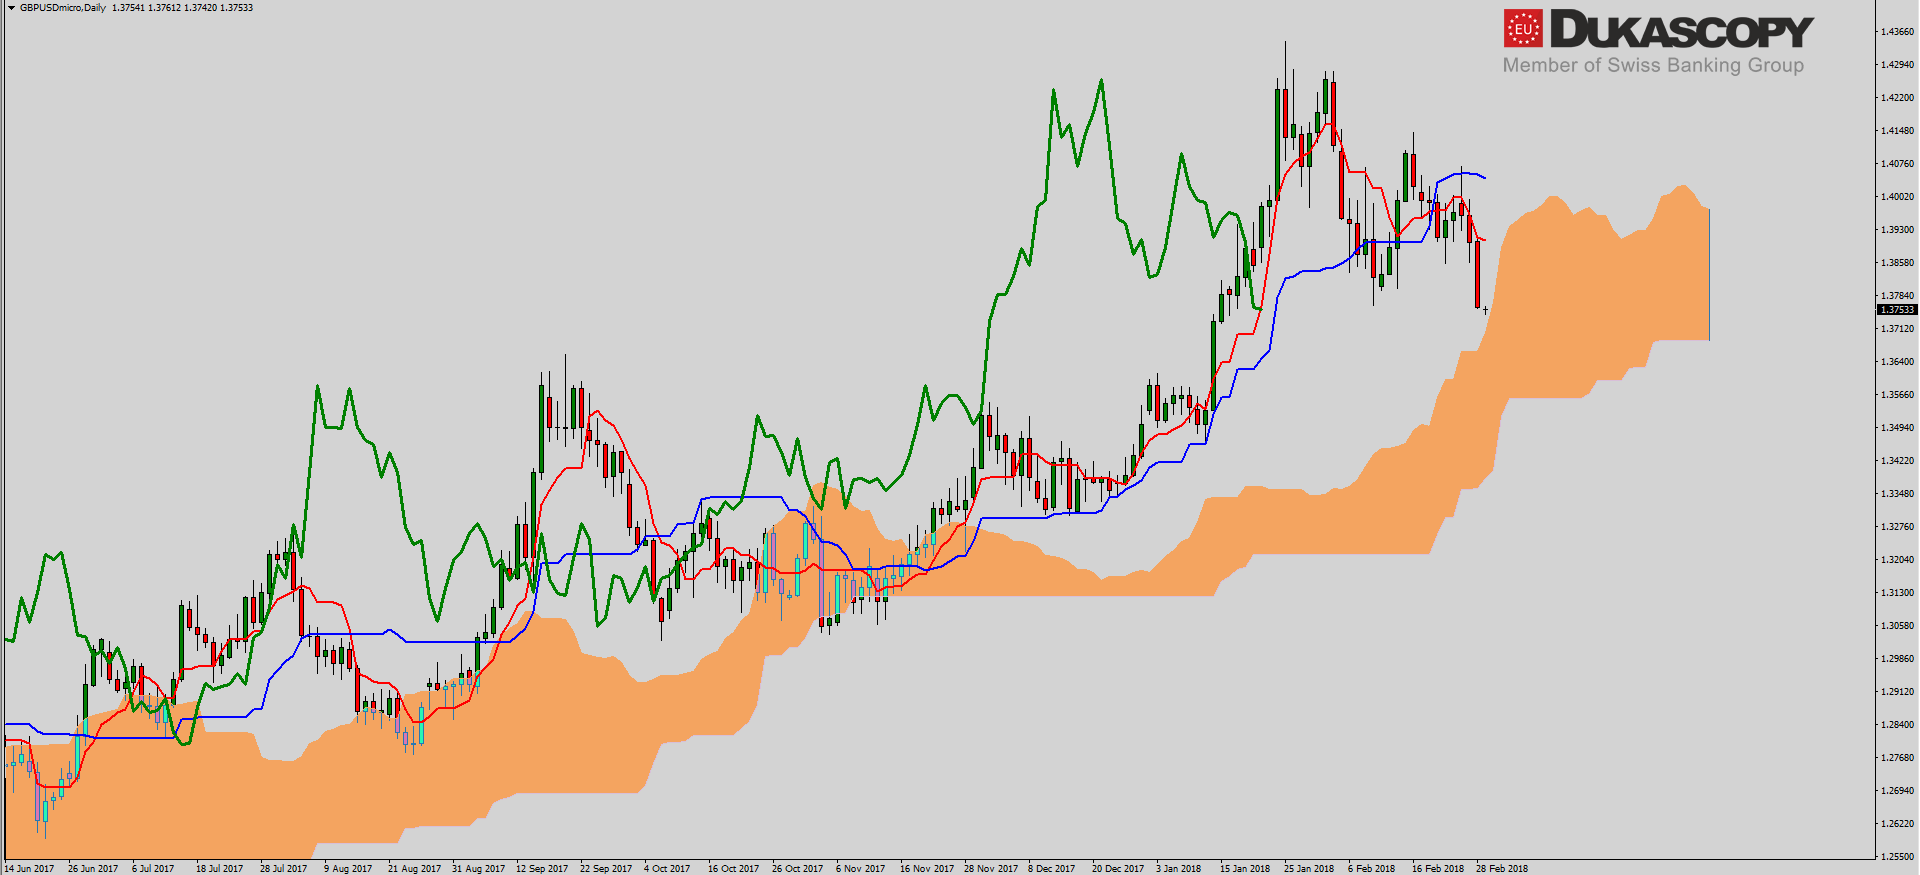 On the Ichimoku chart similar to the EUR/USD also here the Chikou line coped with the price and found support in the form of the Tenkan line. Kijun and Tenkan lines are directed downwards. The price has reached the Senkou Span A line and it is quite possible that it will slip down to the support level. If, however, the pair overcomes this line, the next goal should be the flat line of Senkou Span B.
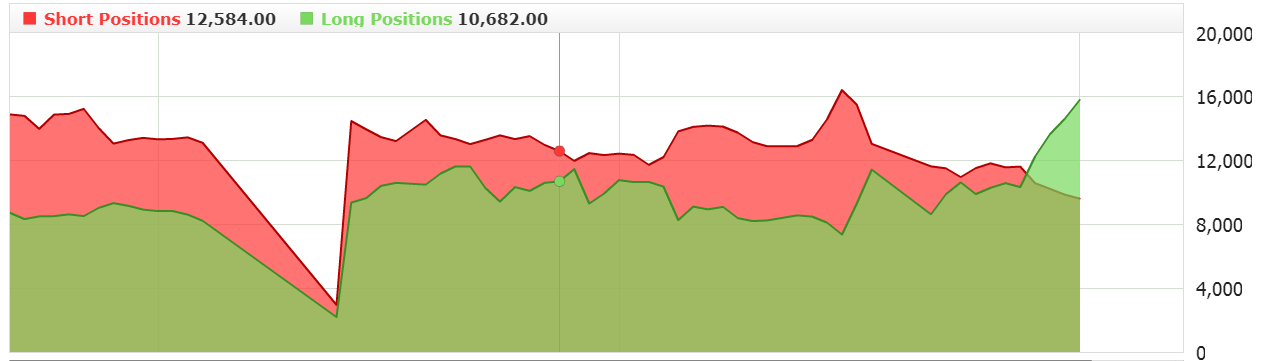
In the sentiment graph, we see a strong increase in long positions and a reduction in short. Ichimoku does not allow us to open positions, so I remain aside.
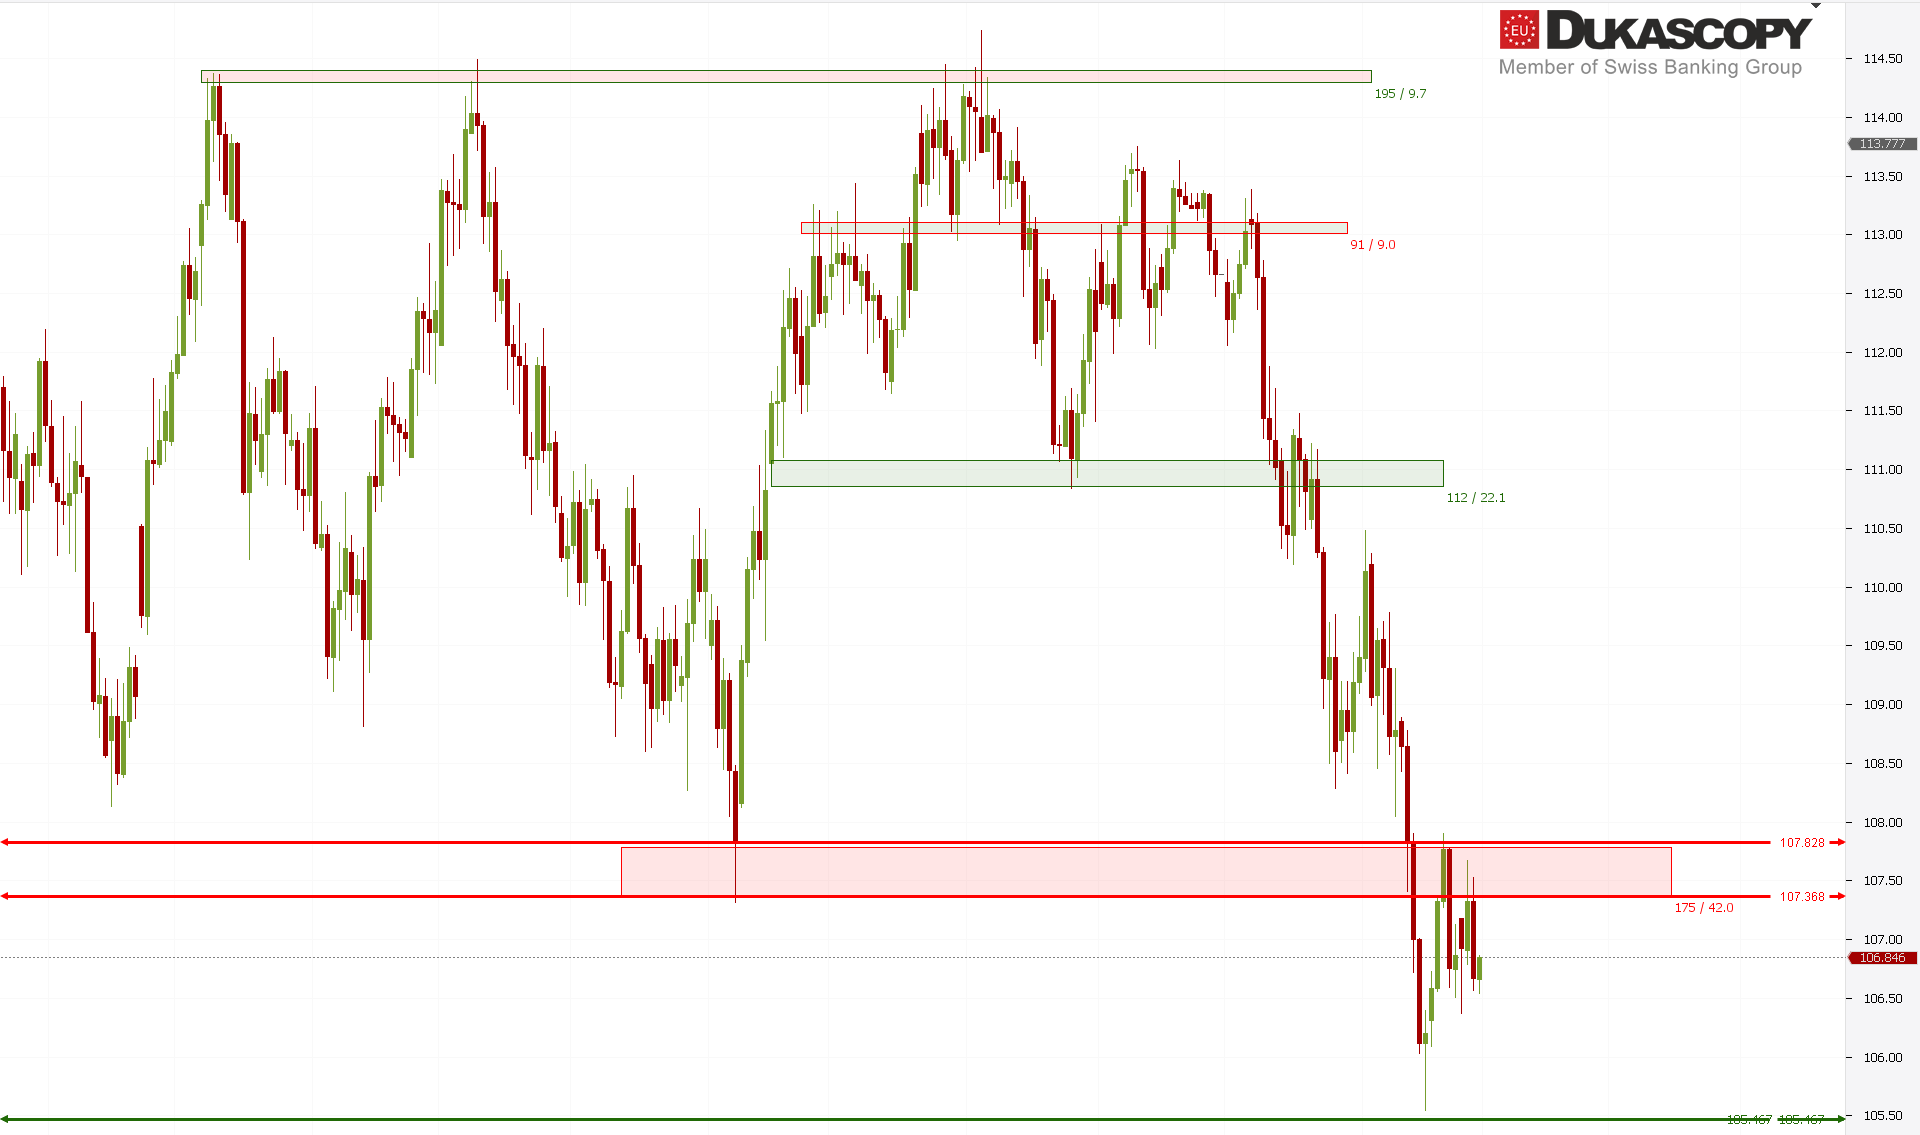 USD/JPY, it’s hard to write anything, because the pair is still in consolidation just under the resistance zone. Only its rejection or defeating will allow further assessment of the chart.
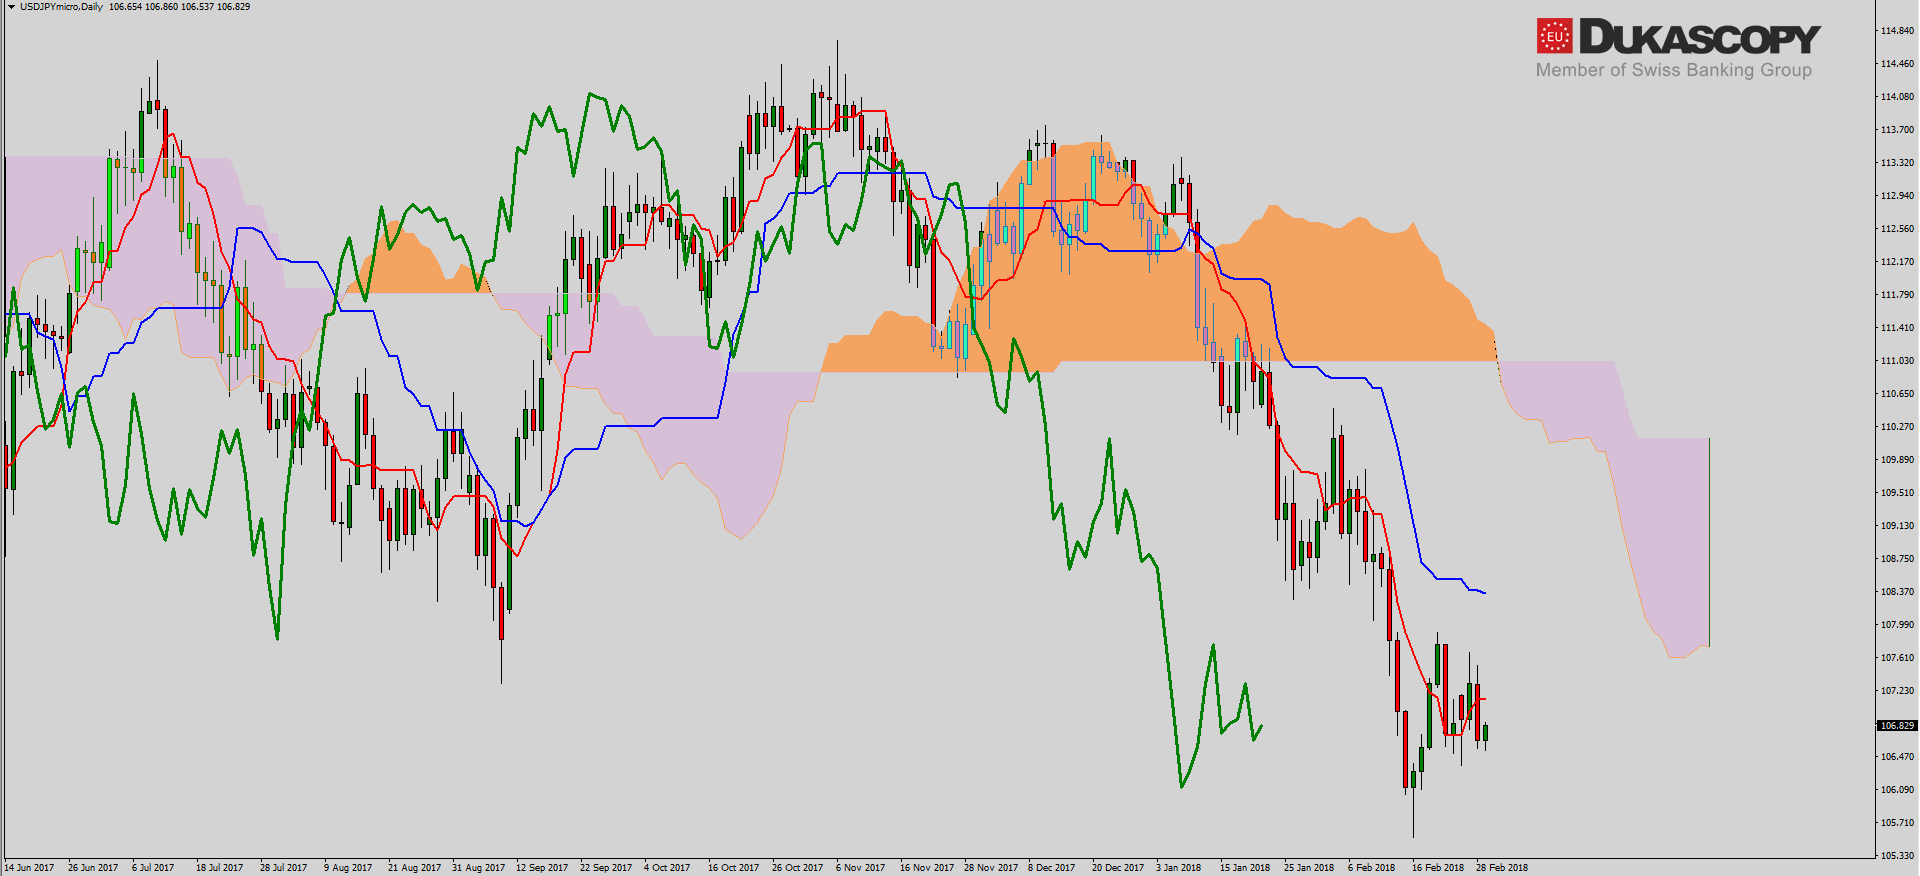 It is similar in Ichimoku. The pair tests the Tenkan line from the bottom to the top thus confirming lateral movement. The move towards the distant Kijun line is still possible and it would take place as a simple correction.
 The sentiment remains bullish. All the time we have an increase in long positions and a reduction of shorts. Here, ichimoku also does not allow us to open positions.


