“Search, Analyse, Trade” is a series of Price Action and Elliott Waves analyses. Its detailed step-by-step description can be found over here. I invite you to today’s review of selected currency pairs and potential trading opportunities. The analyses are based on the Dukascopy sentiment that you can get here.

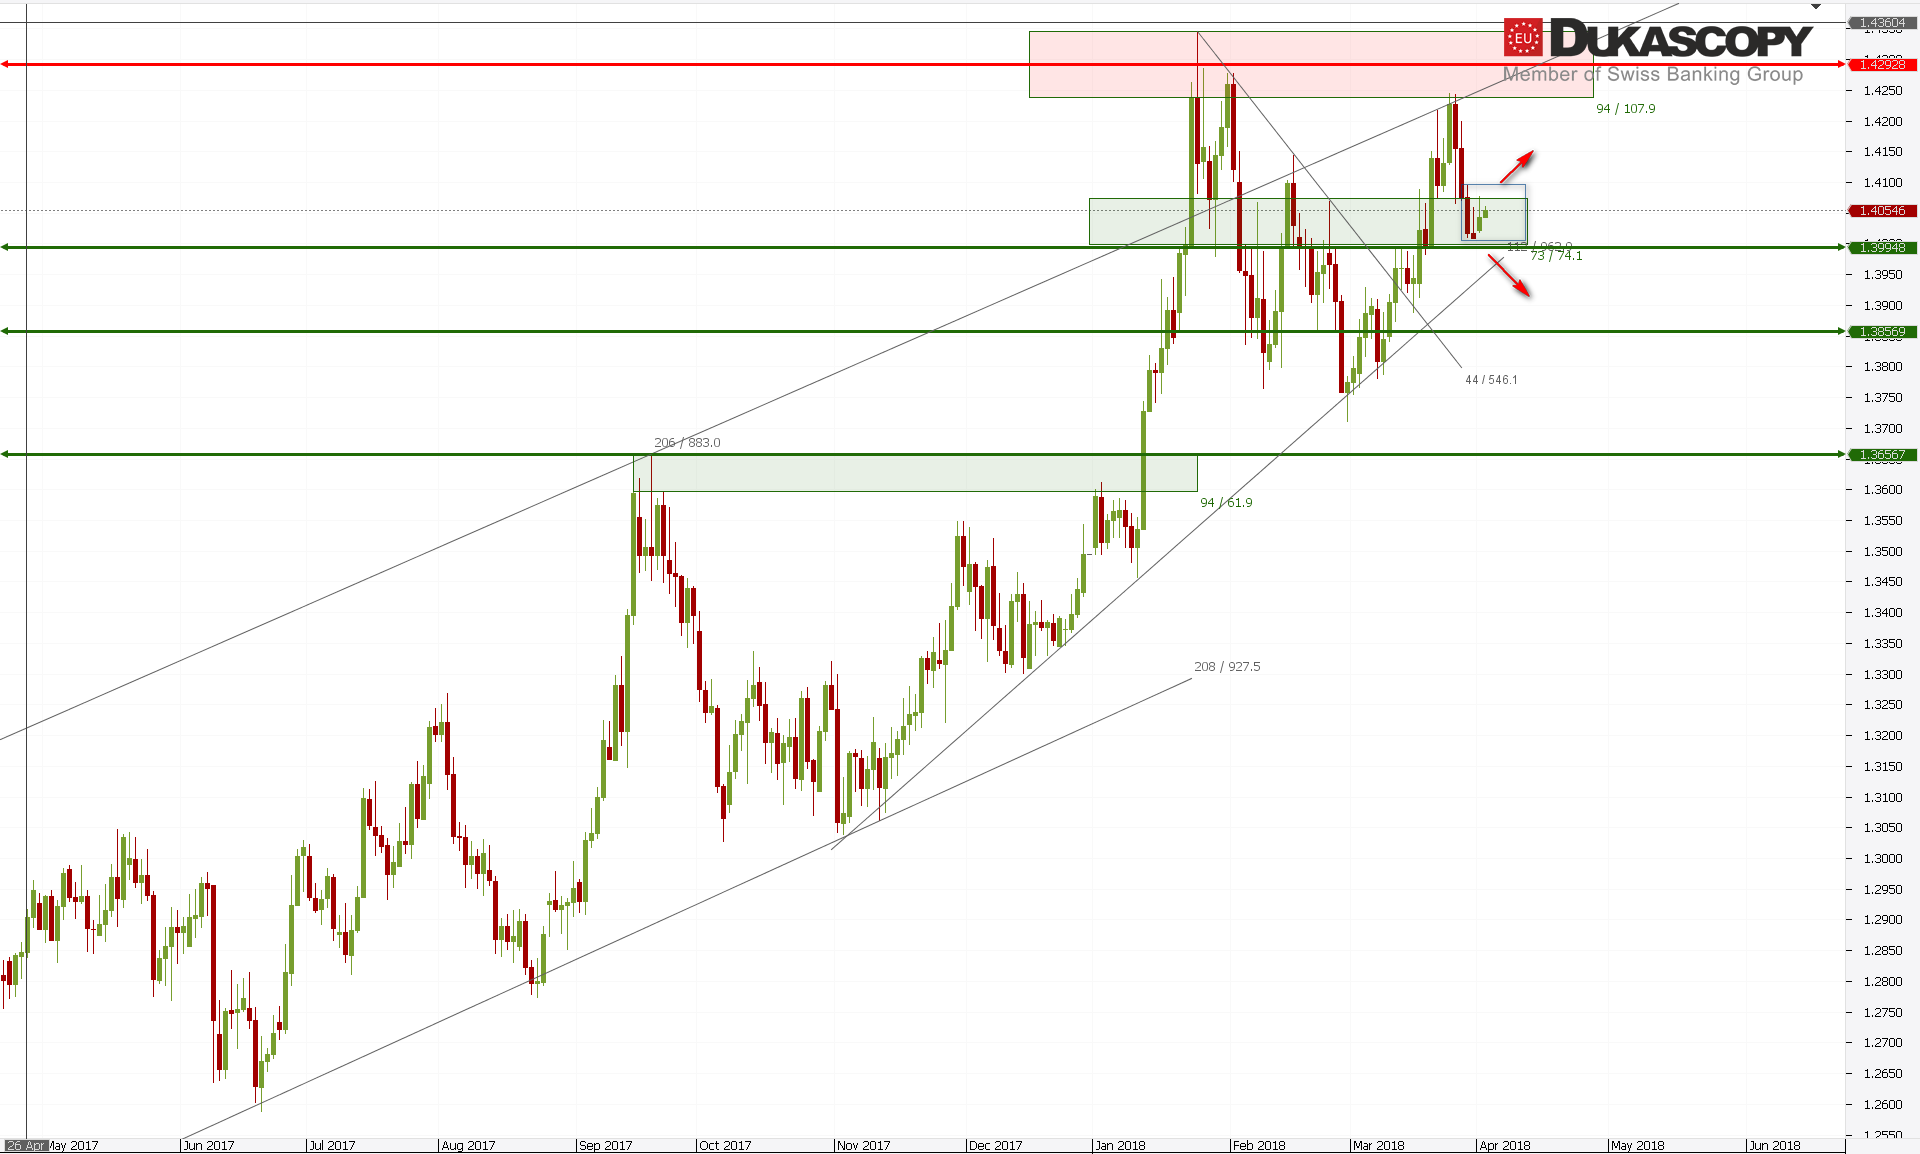
For a couple of days, EUR/USD stays in one place just below the internal resistance line and over the line extended on the lows. If we look at the last drop on the lower TF, we will see a downward five. Therefore, there is a high probability of continuing downward movement and this should be the C wave of the entire correction structure or the c wave of the next three, which will expand and stretch the consolidation in time.
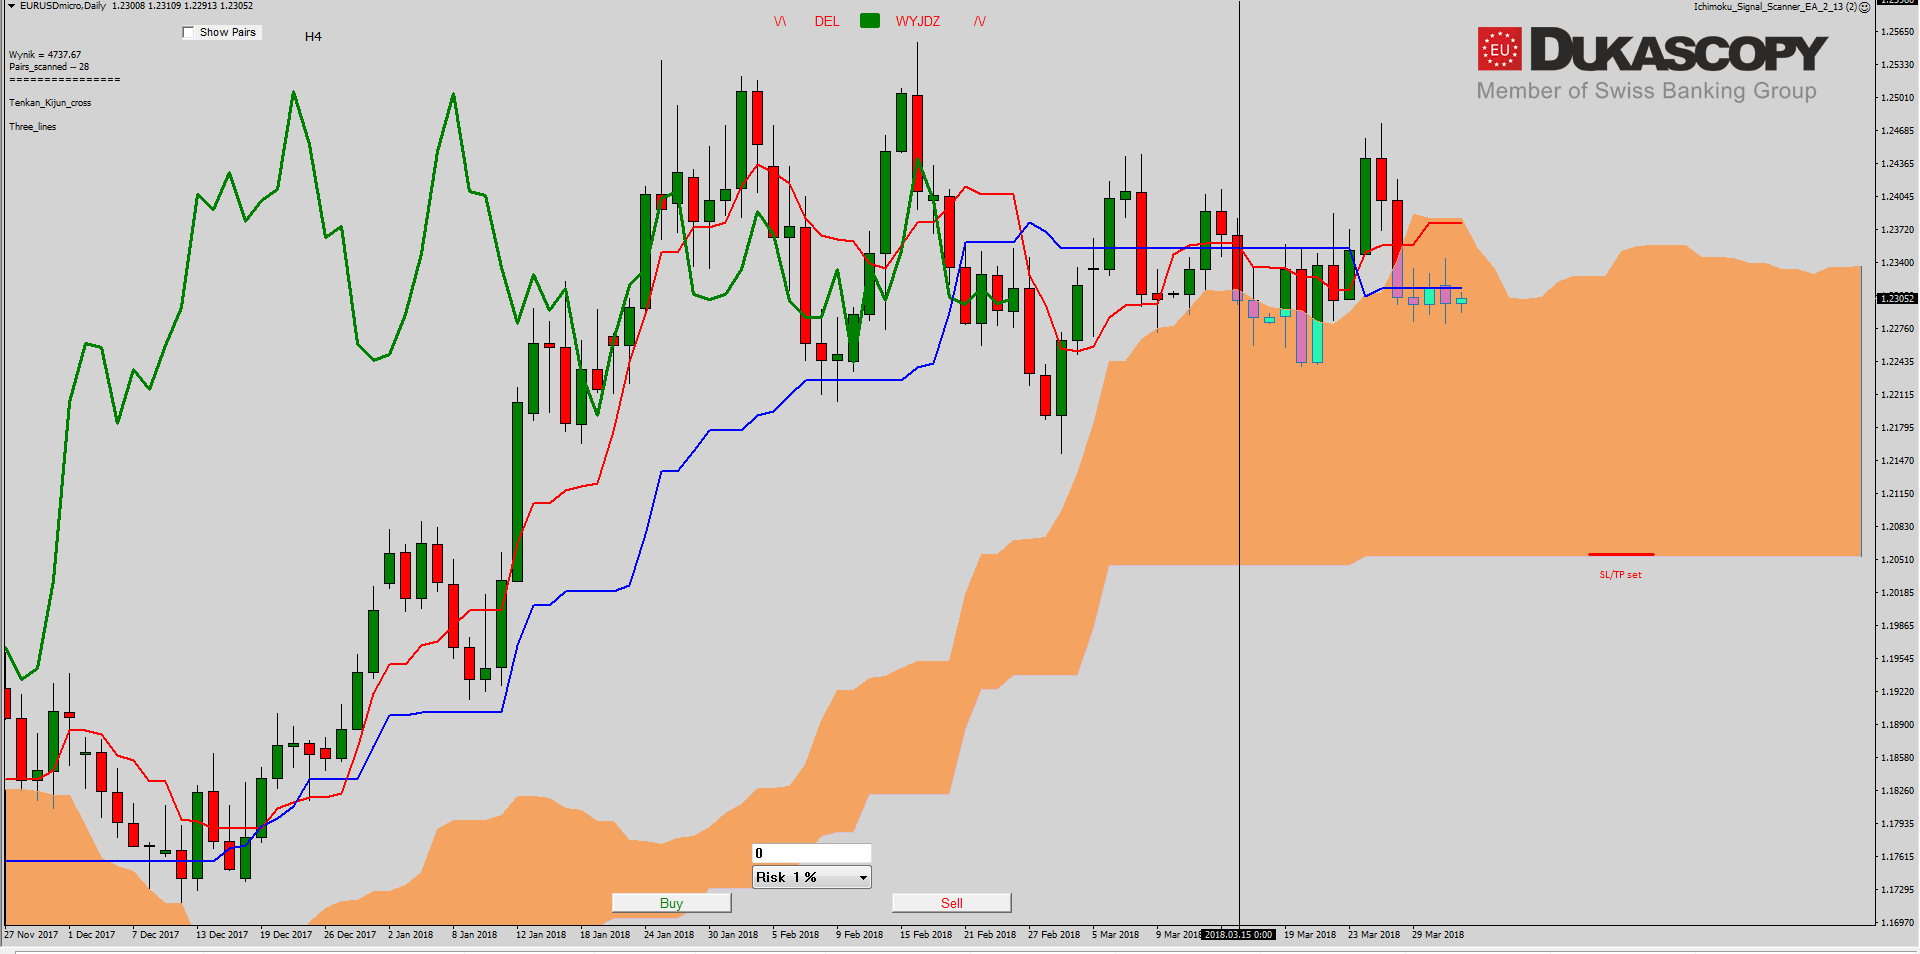 On the Ichimoku chart, the pair still remains under the Kijun flat line. If we assume that the last drop is an impulse then the pair before continuing the decreases can test from the bottom line Tenkan or Senkou Span A and it would be wave 2B.
The rejection of these lines in connection with the sentiment, which is neutral, will be an opportunity to look for a position to play on the C wave.
The partner of “Search, Analyse, Trade” series is a Dukascopy Europe broker who gives its customers access to ECN accounts in different currencies.
Trade on Forex, indices and commodities thanks to Swiss FX & CFD Marketplace. Open free trading account right now.
Also, the GBP/USD does not show much willingness to be active. The pair remains locked in Inside Bar just above the lower limit of the support zone. The currently viewed increase may be a 2B wave, ie a correction of the last wave of decline. Rejection of the upper limit of Inside Bar should be the beginning of the 3C wave. If the upward movement is to be continued, the resulting correction should not break the accelerated trend line.
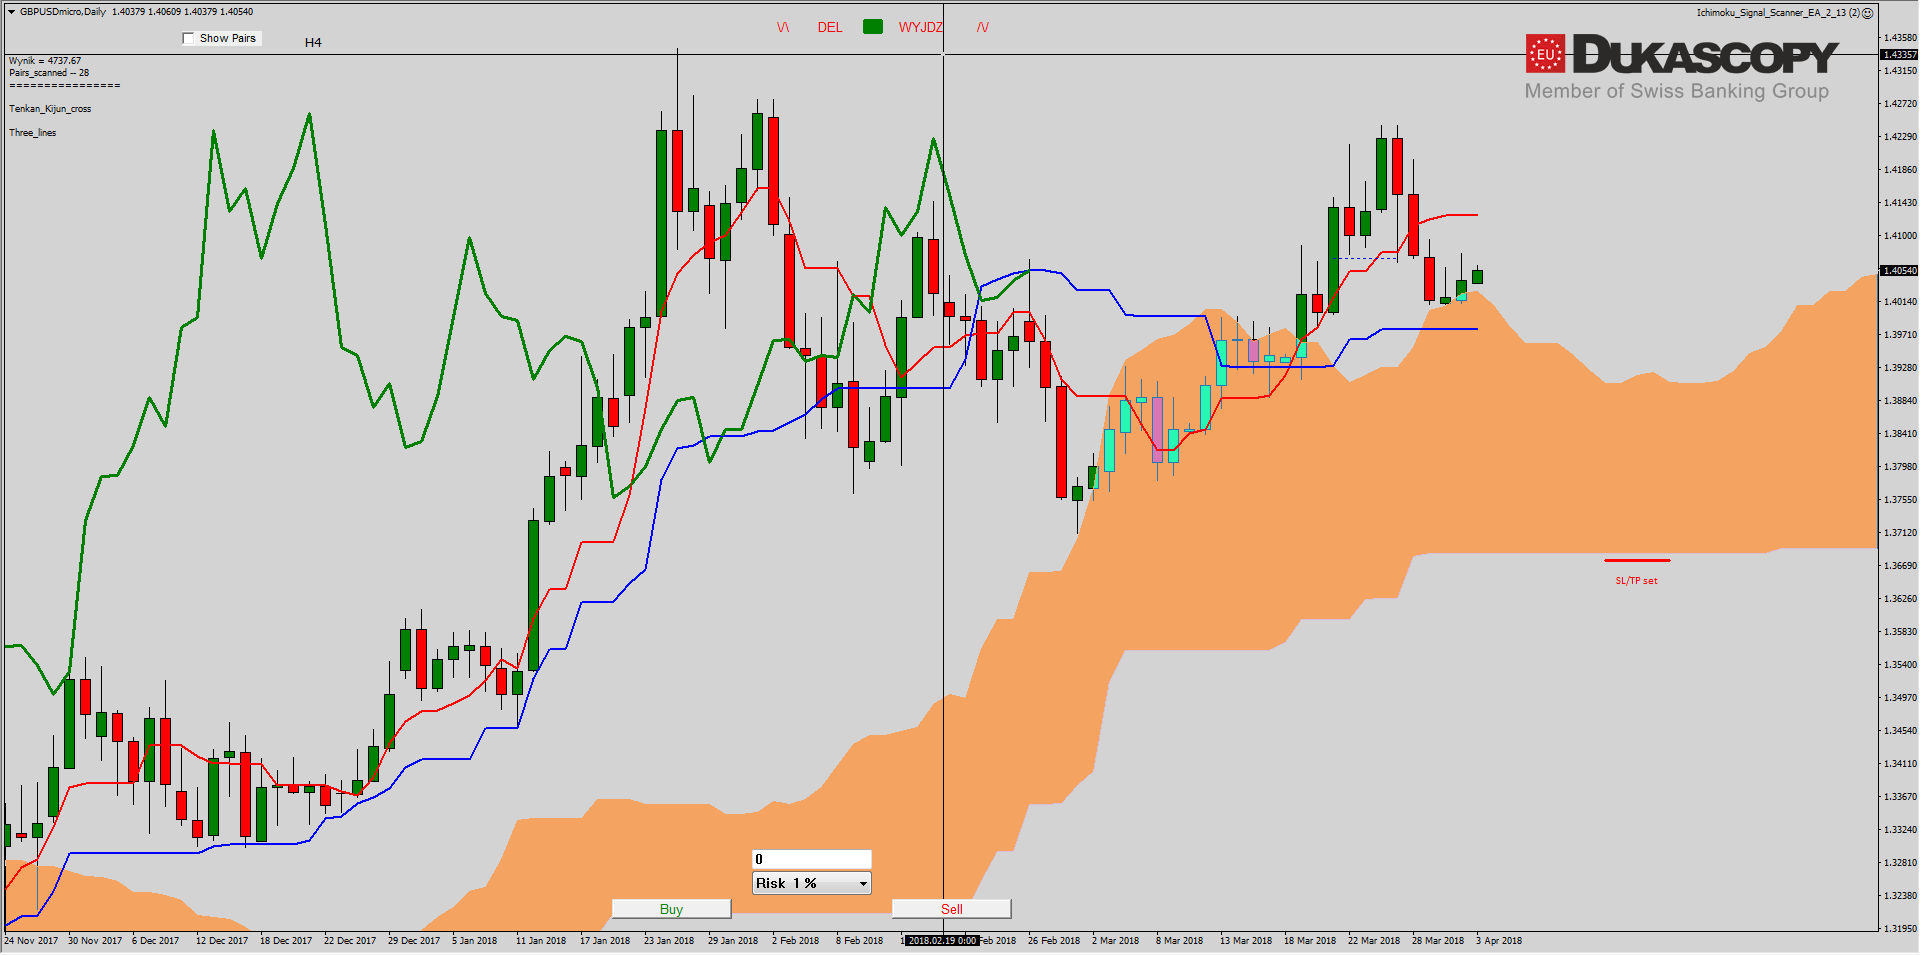 On the Ichimoku chart, the pair is testing the Senkou Span A line, which is located right over Kijun. The Tenkan and Kijun lines remain bullish. Although it must be noted that Tenkan is slowly starting to go flat. Flat is also the Kijun line, which can attract the price to itself. I’m counting on such a turn of events.
 The re-test of the line from the top with a neutral sentiment will be an opportunity to look for a long position on the lower TF.
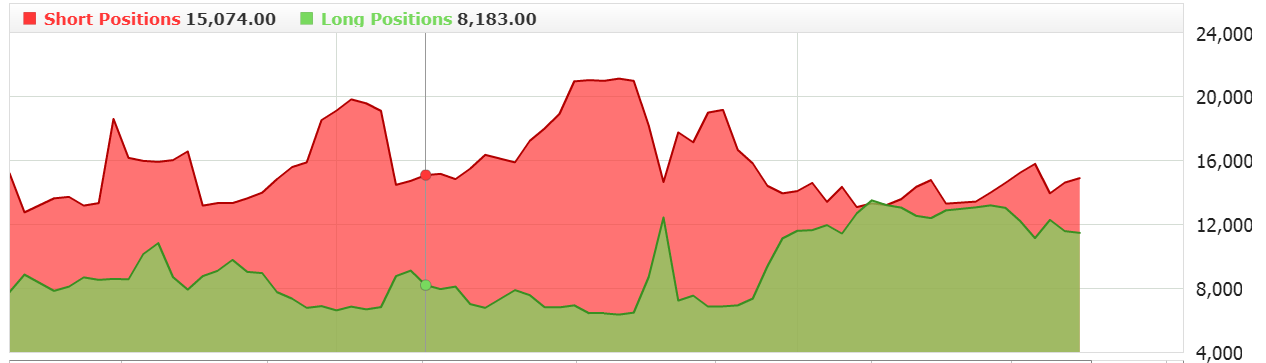
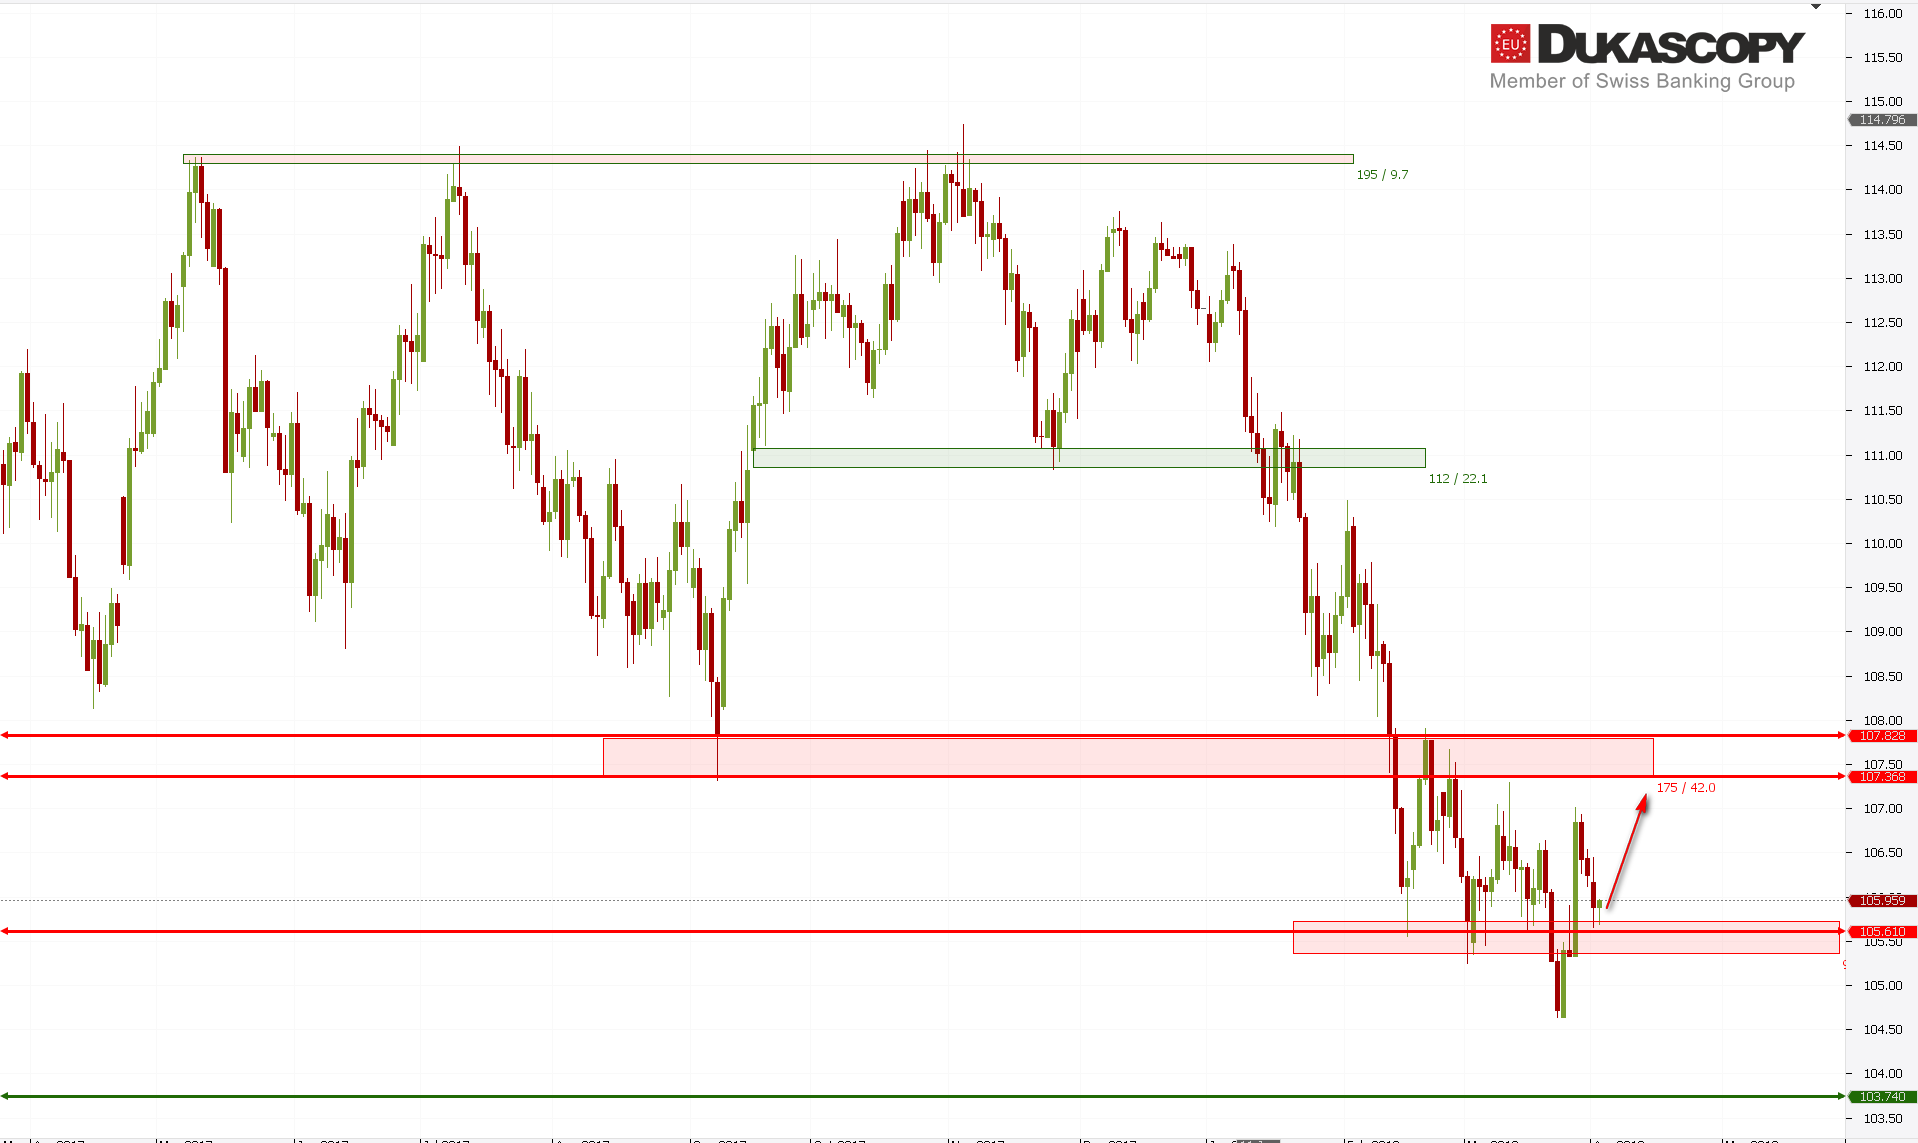 Declines on the USD/JPY reached the upper limit of the support zone. The last strong wave of growth looked like the third wave and I hoped that the system would be completed and a growth five would be created. Unfortunately, but nothing like that has happened, and the drop now being viewed is too strong to treat it as a fourth sub-wave. However, it can be treated as the right arm of the hypothetical H&S formation and wave 2B, ie the correction of the last growth. If the currently tested support zone is rejected, there is a chance for a 3C wave and the implementation of the H&S formation.
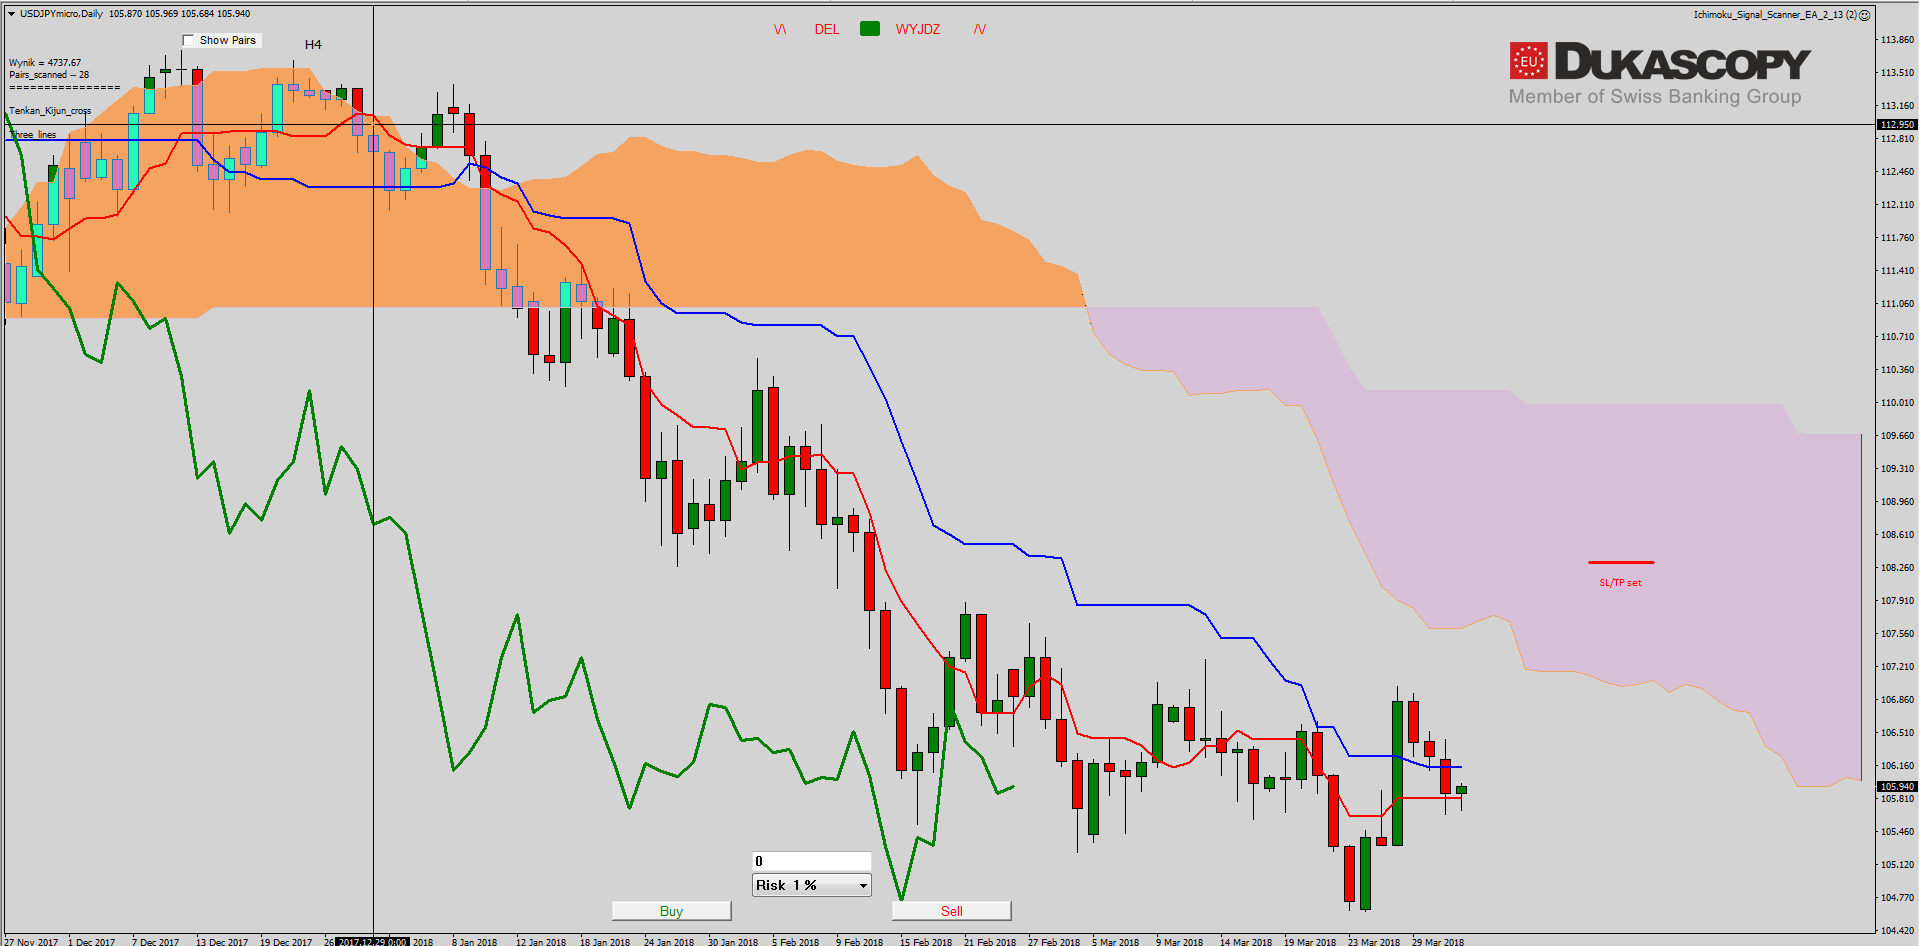
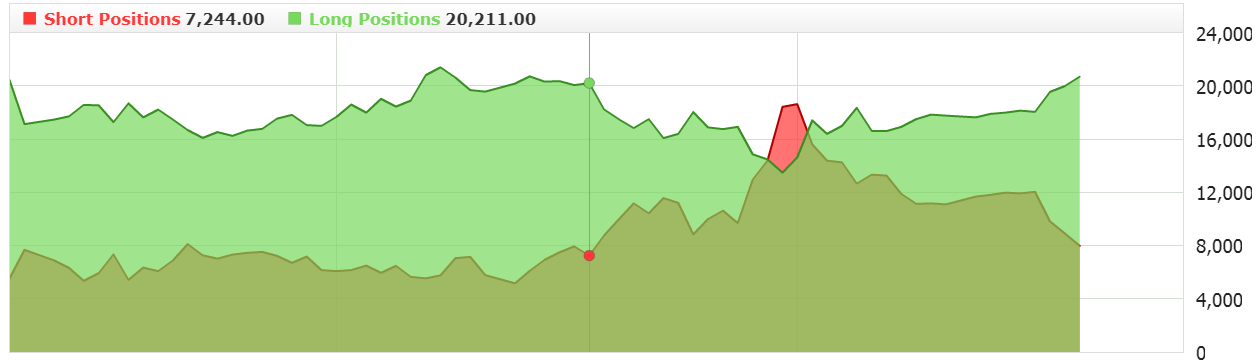 On the Ichimoku chart, the pair unfortunately crossed the Kijun line and is now under it. I hoped that the line would be defended and an opportunity would arise to play long on the movement towards Senkou Span A, especially as sentiment favors it, but nothing like this happened. Now new growth wave is possible but pair must defend the currently tested Tenakn and breach above Kijun. Then you will be able to think about looking for a long position.


