“Search, Analyse, Trade” is a series of Price Action and Elliott Waves analyses. Its detailed step-by-step description can be found over here. I invite you to today’s review of selected currency pairs and potential trading opportunities. The analyses are based on the Dukascopy sentiment that you can get here.
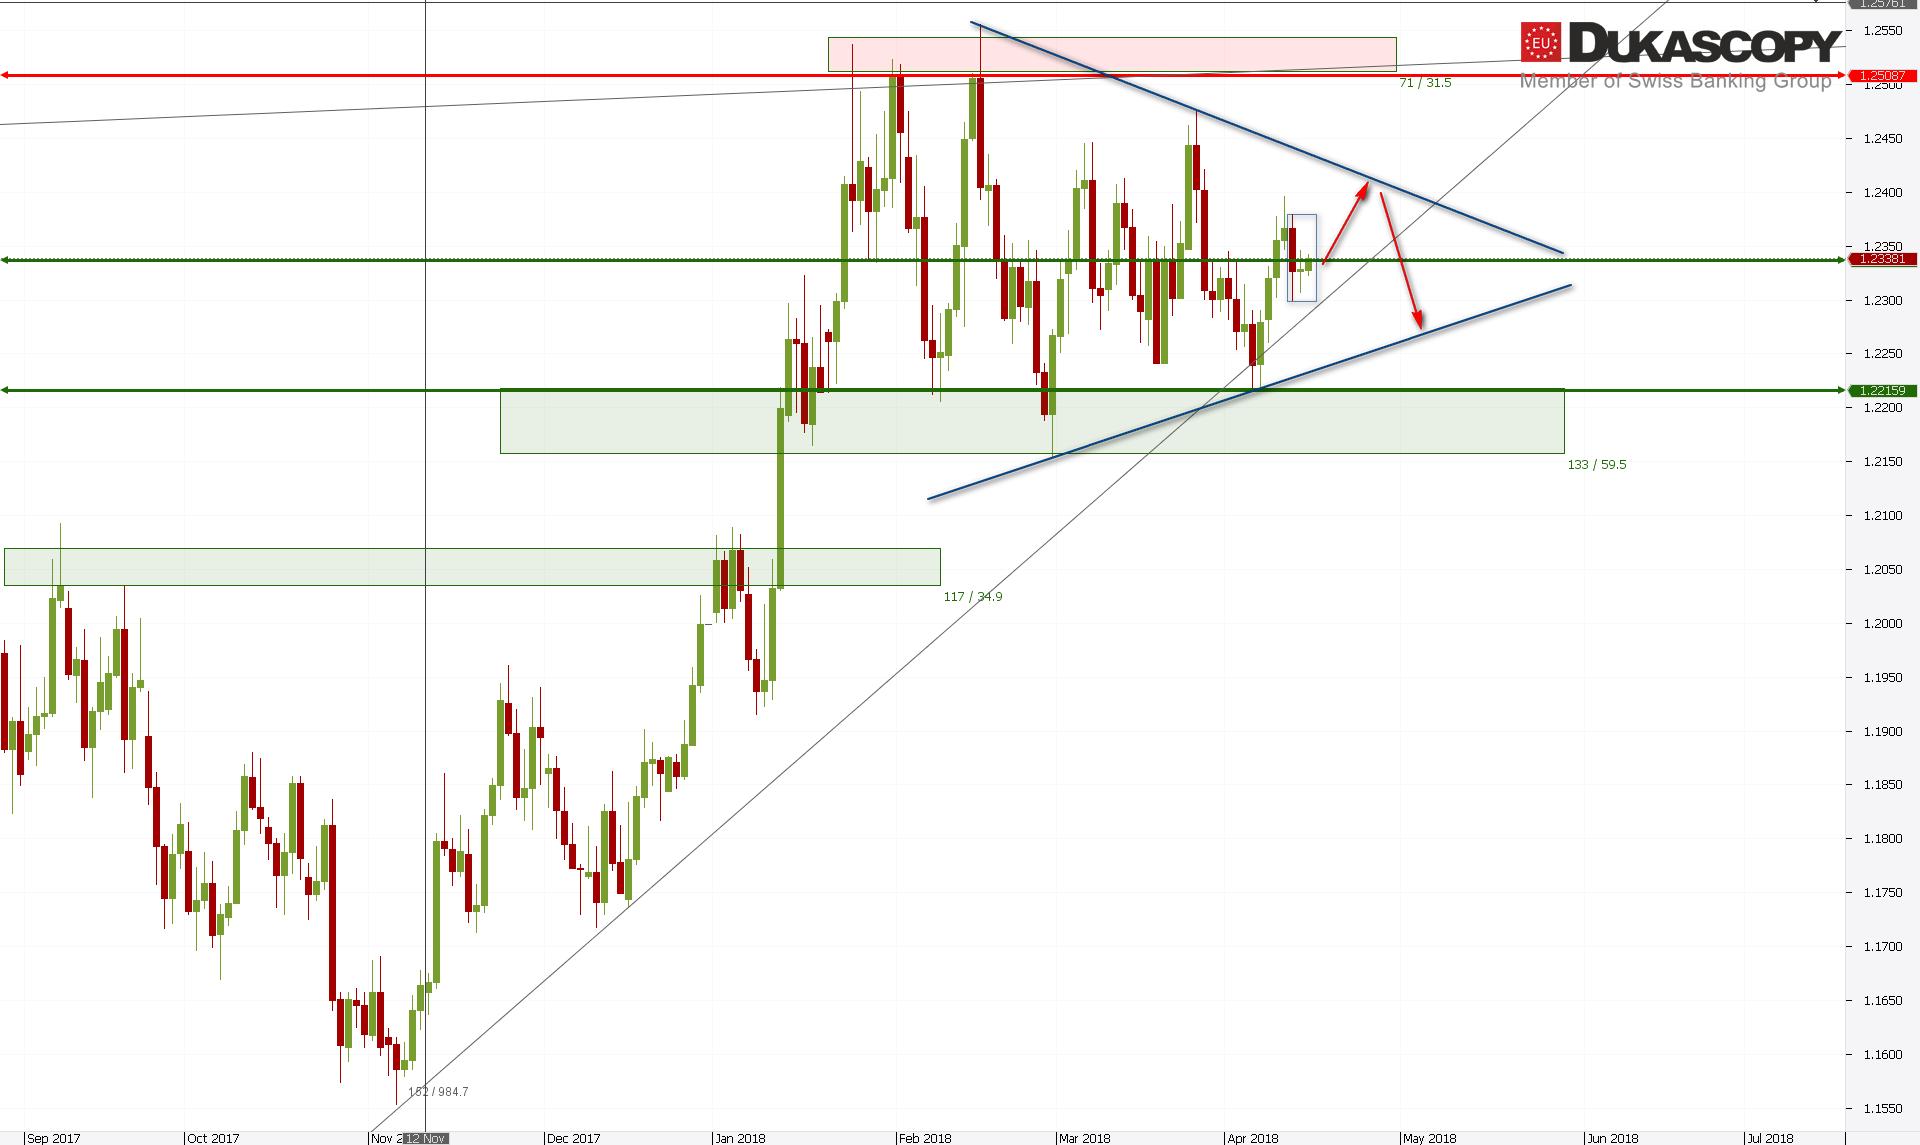
EUR/USD oscillates between the horizontal S/R line. The pair created a small Inside Bar last week and breaking out thru the top should initiate another upward wave towards the upper limit of the hypothetical triangle formation. It will be a c wave of wave d. After completing it, we should see the e wave and then the break from the consolidation. Because I assume that what we see is the fourth wave of the last wave of growth, the break should be thru the top.
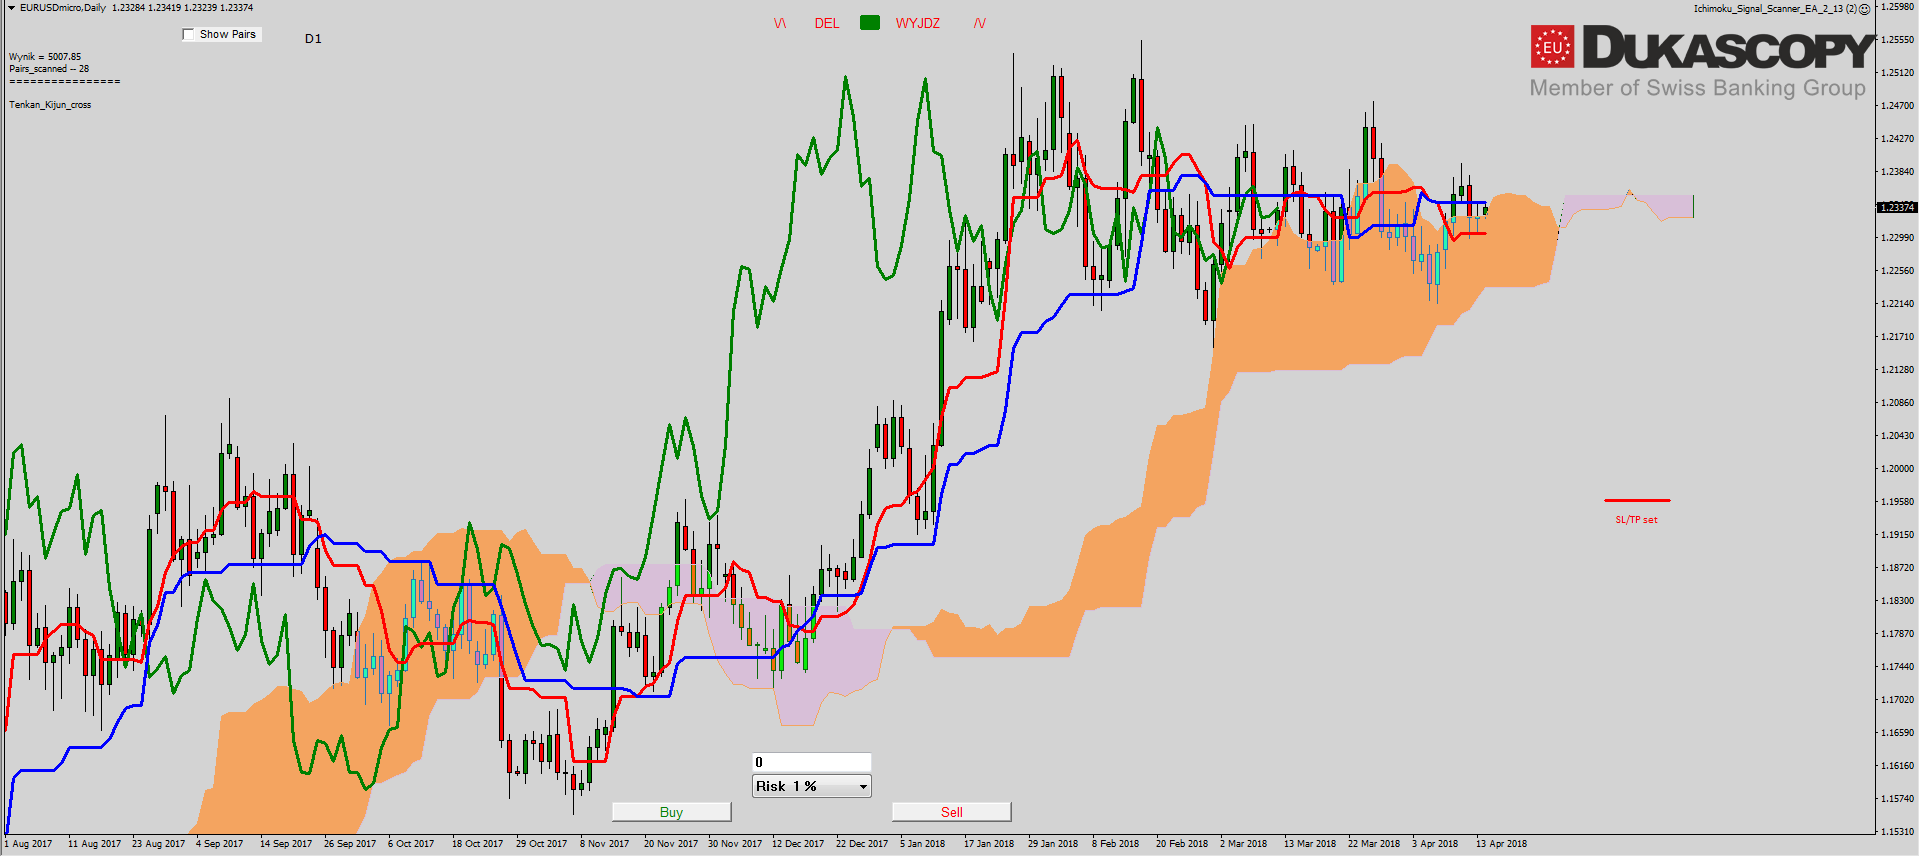

On the Ichimoku chart, the pair was between Kijun, Tenakan and Senkou Span A. The range is tightening, so in the near future, we should see a move from these lines. It should determine the direction for the next sessions. Defeating Kijun is an upward movement based on the wave d in the triangle in direction of its upper limit. Defeating Senkou Span A and Tenkan should result in a move towards flat Senkou Span B. The sentiment has been neutral for some time. There is no change in the number of trades. You can play in two directions, but currently, the pair is not playable for me, so I stay on the side.
The partner of “Search, Analyse, Trade” series is a Dukascopy Europe broker who gives its customers access to ECN accounts in different currencies.
Trade on Forex, indices and commodities thanks to Swiss FX & CFD Marketplace. Open free trading account right now.
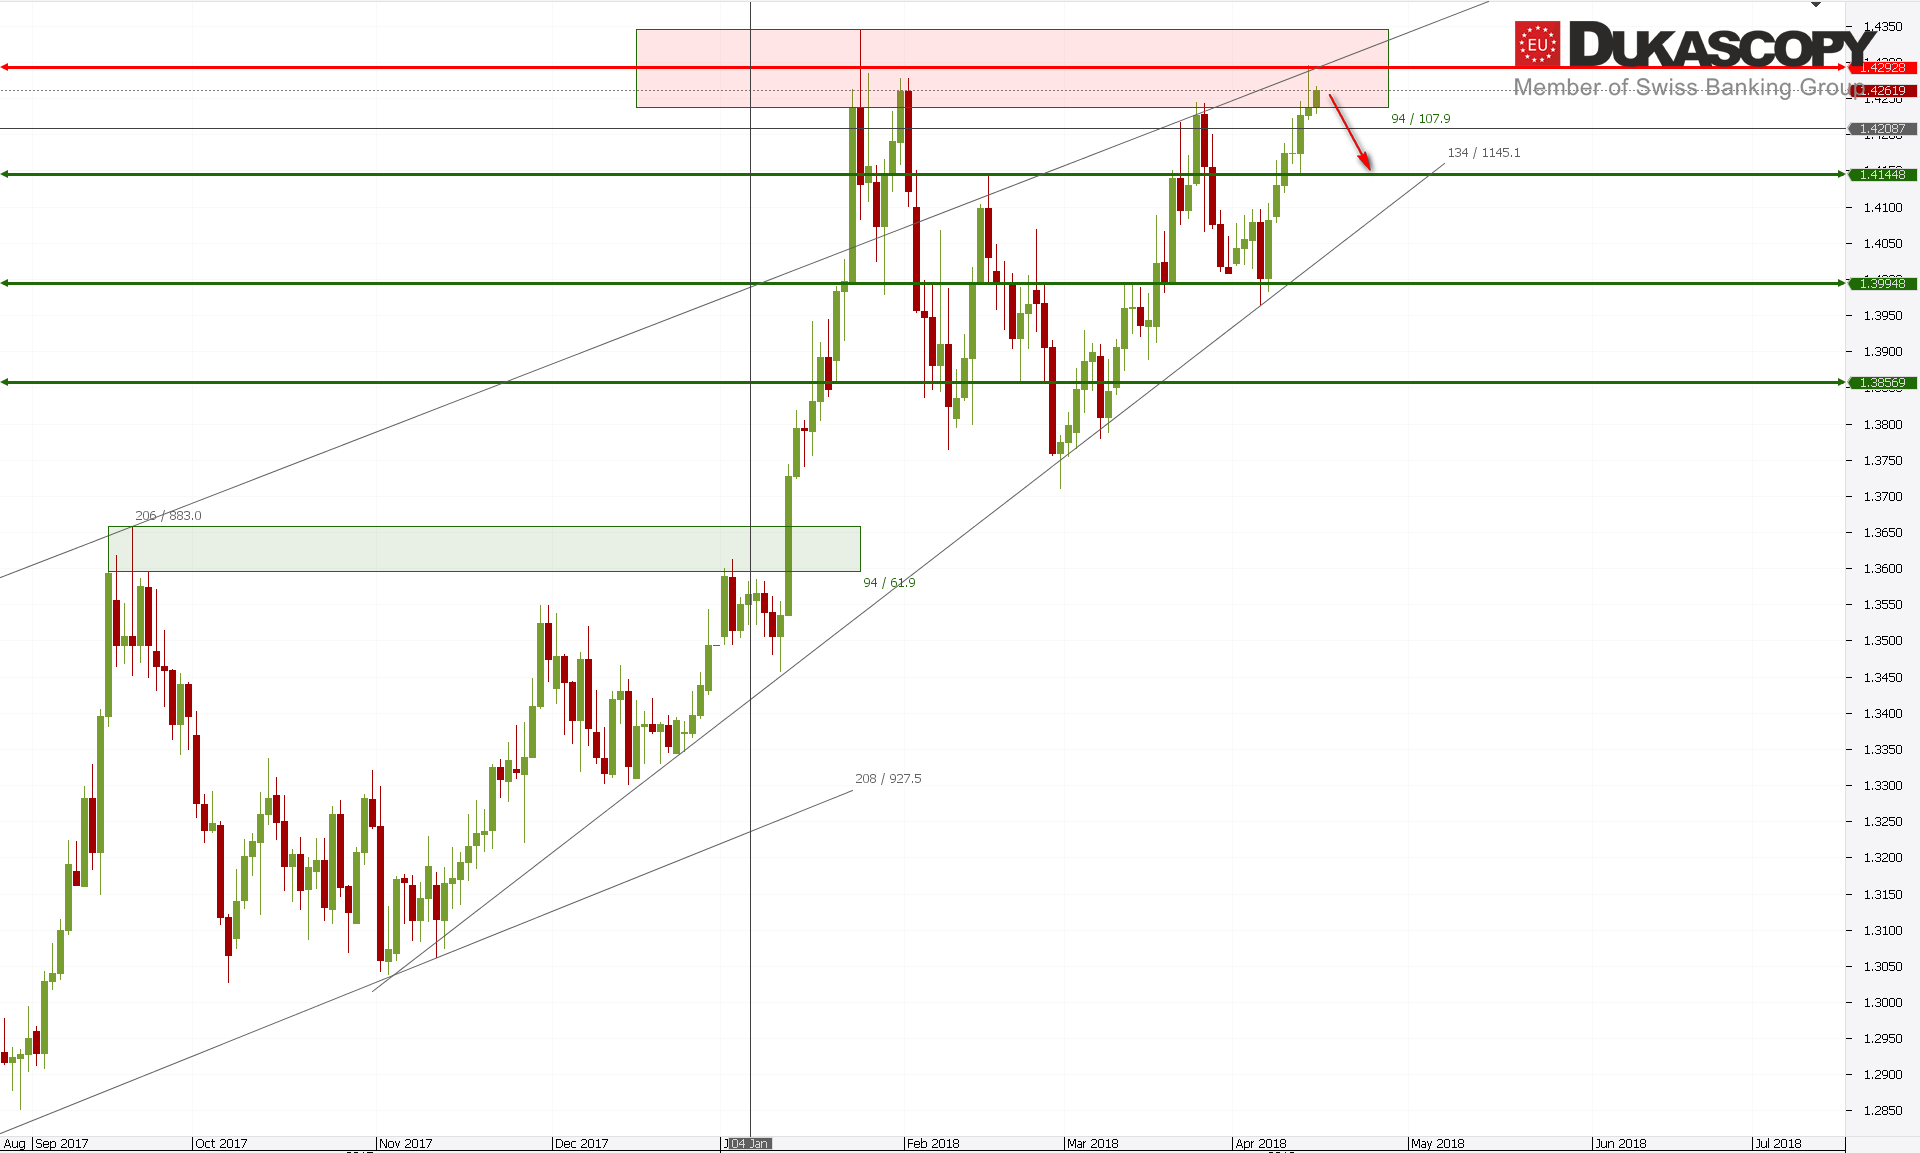 GBP/USD is still not able to cope with the lower limit of the resistance zone. From the morning we see another attempt. If it succeeds, the next obstacle to the continuation of growth will be the line of the old growth channel. Rejection of levels should result in a correction towards the nearest S/R line. The whole recently built wave system may be the beginning of the finishing triangle or the fifth wave of the last wave of growth. The third scenario is the 1212 system, which is a very strong growth pattern.
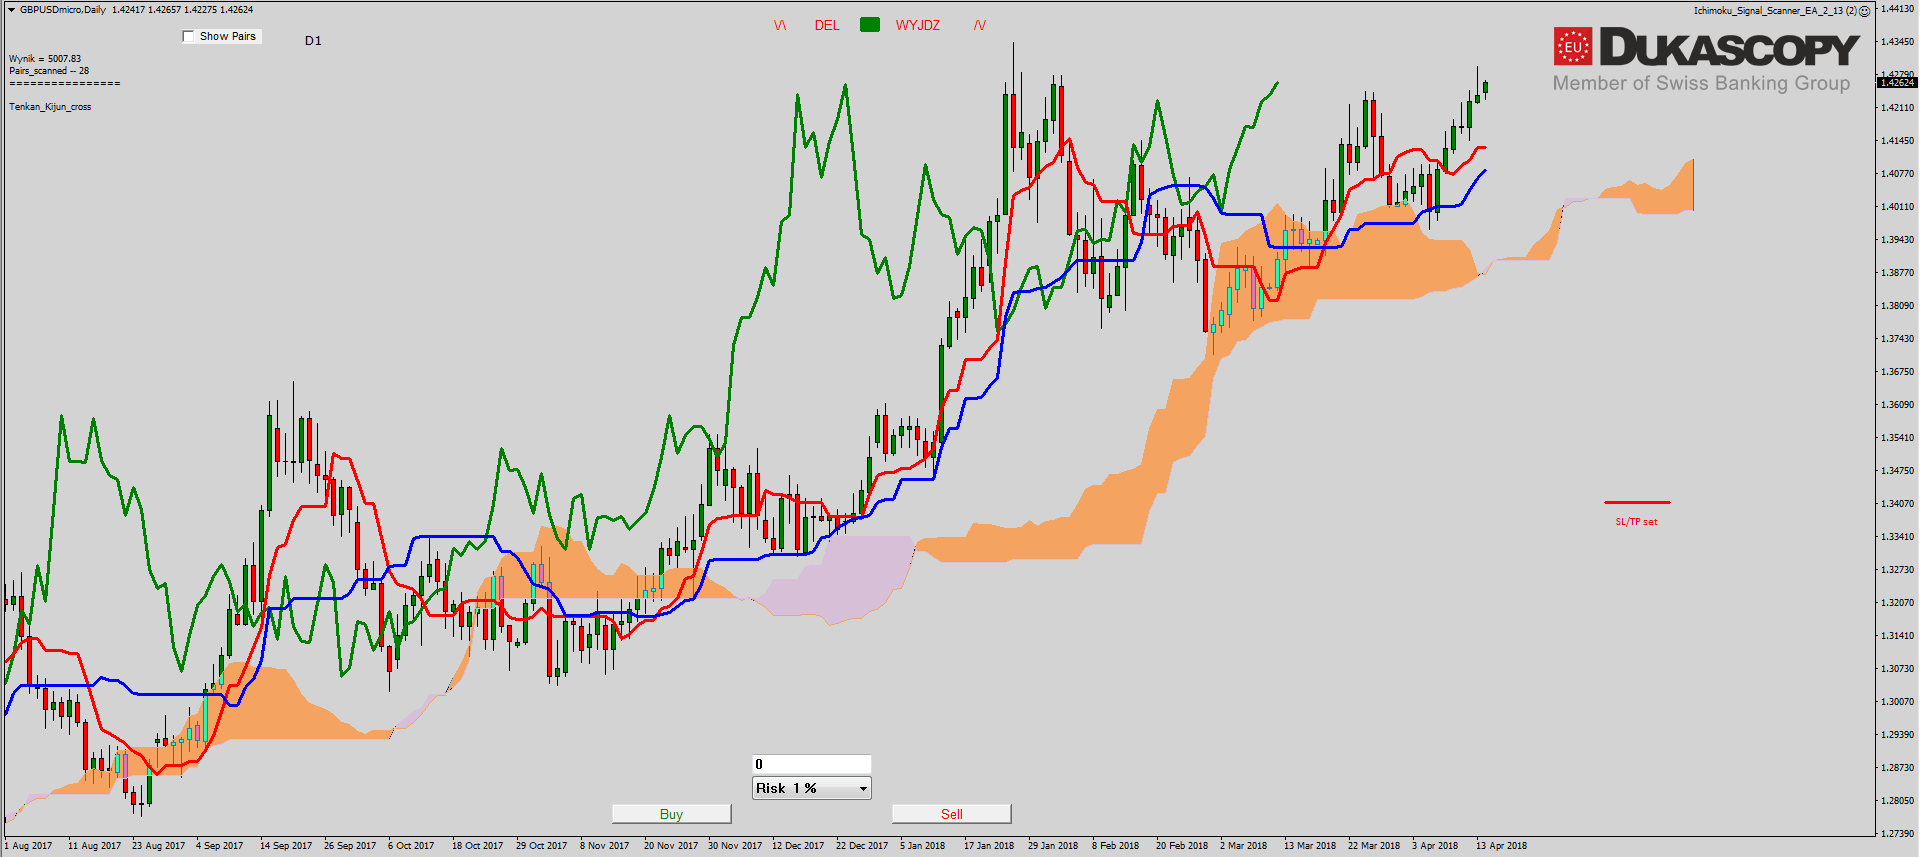
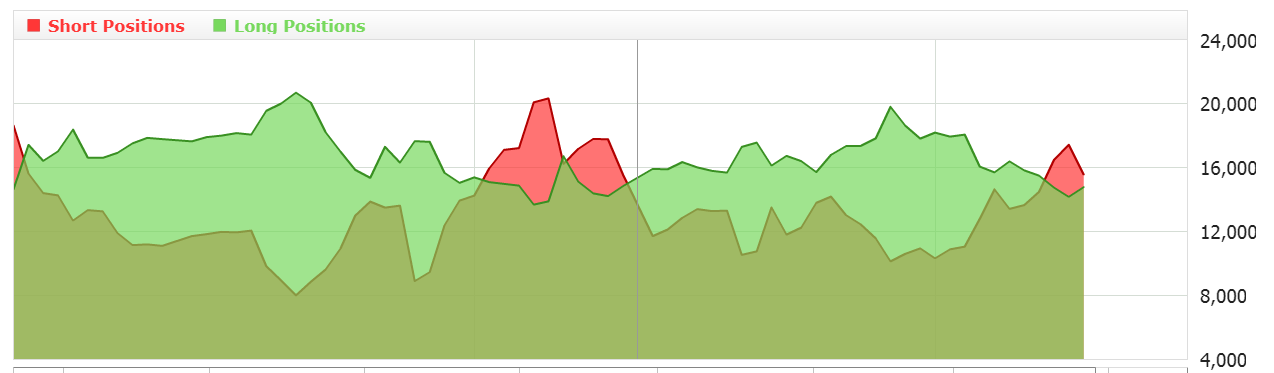
The Ichimoku chart is unchanged. Still, all lines are laid out bullish. The Tenkan and Kijun lines follow the price. Senkou Span A is growing, also Senkou Span B is starting to grow. Chikou line, if manages to go beyond the last high, will get far away from the price, what will confirm bullish momentum. Small players still do not believe in defeating such an important resistance zone and are adding short positions. If they are wrong, they will be a “fuel” for a possible third wave. I stay on the side and wait for a possible correction towards the Tenkan line.
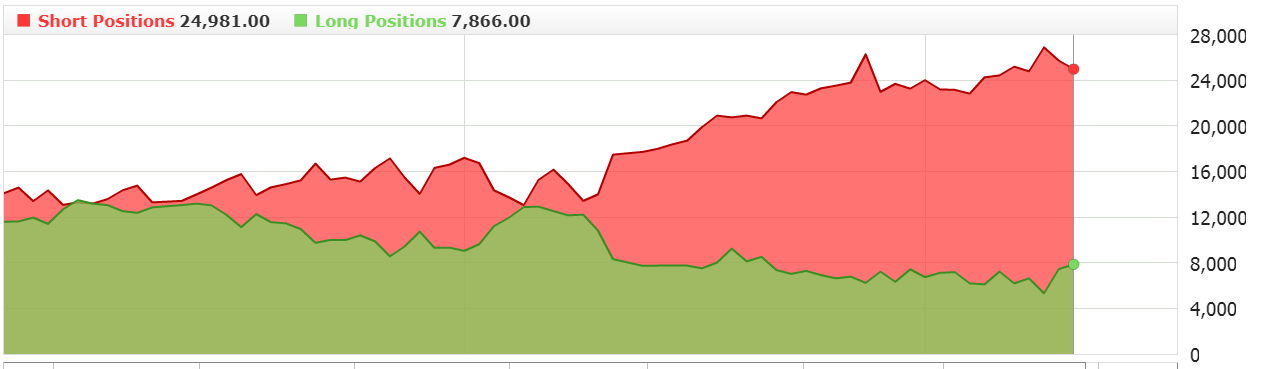
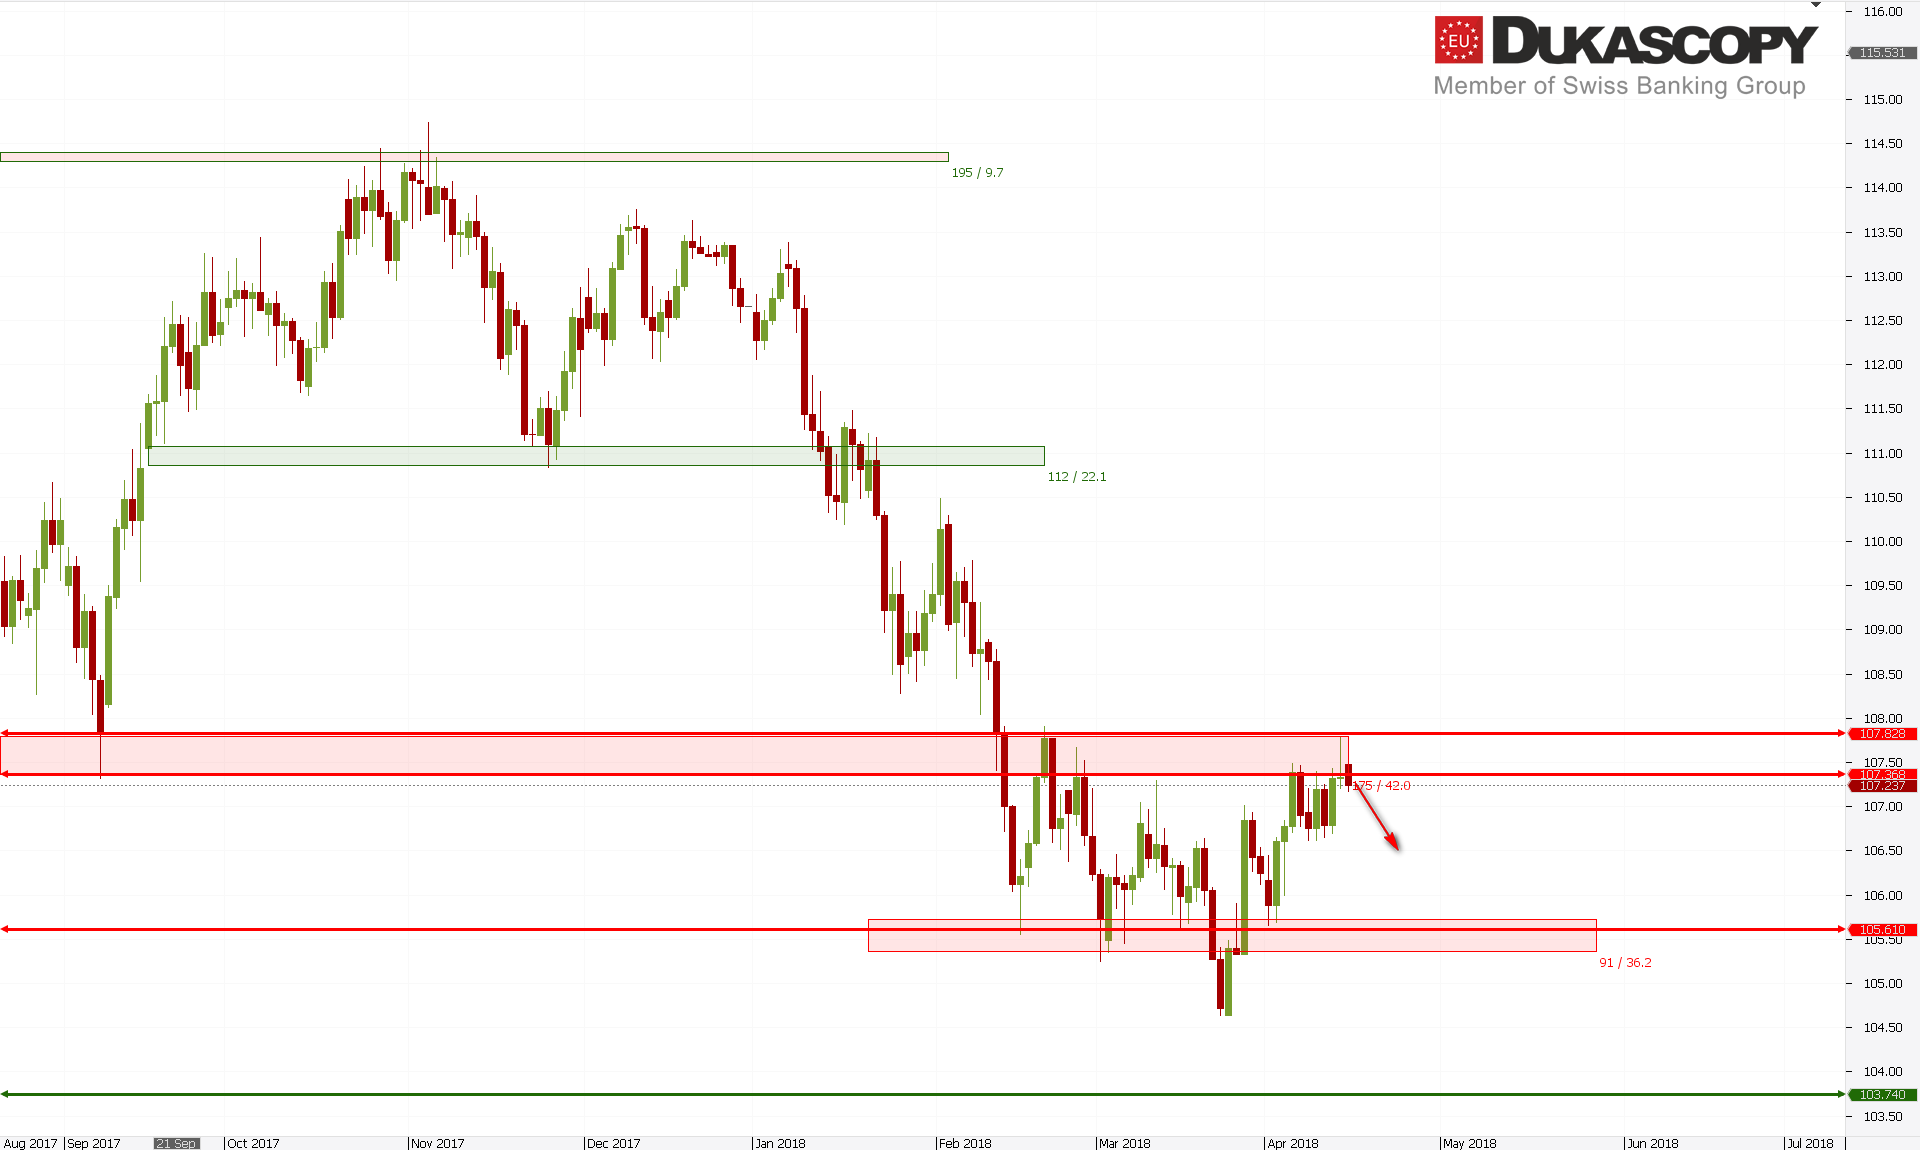 USD/JPY pair stopped growth at the upper limit of the key resistance zone. Its defeat will be tantamount to overcoming the neck line of the hypothetical formation of the head with the arms, which should lead to stronger increases. However, if the pair rejects the tested levels, we should see a move towards the closest support line, and defeating it for the next test of the key resistance zone.
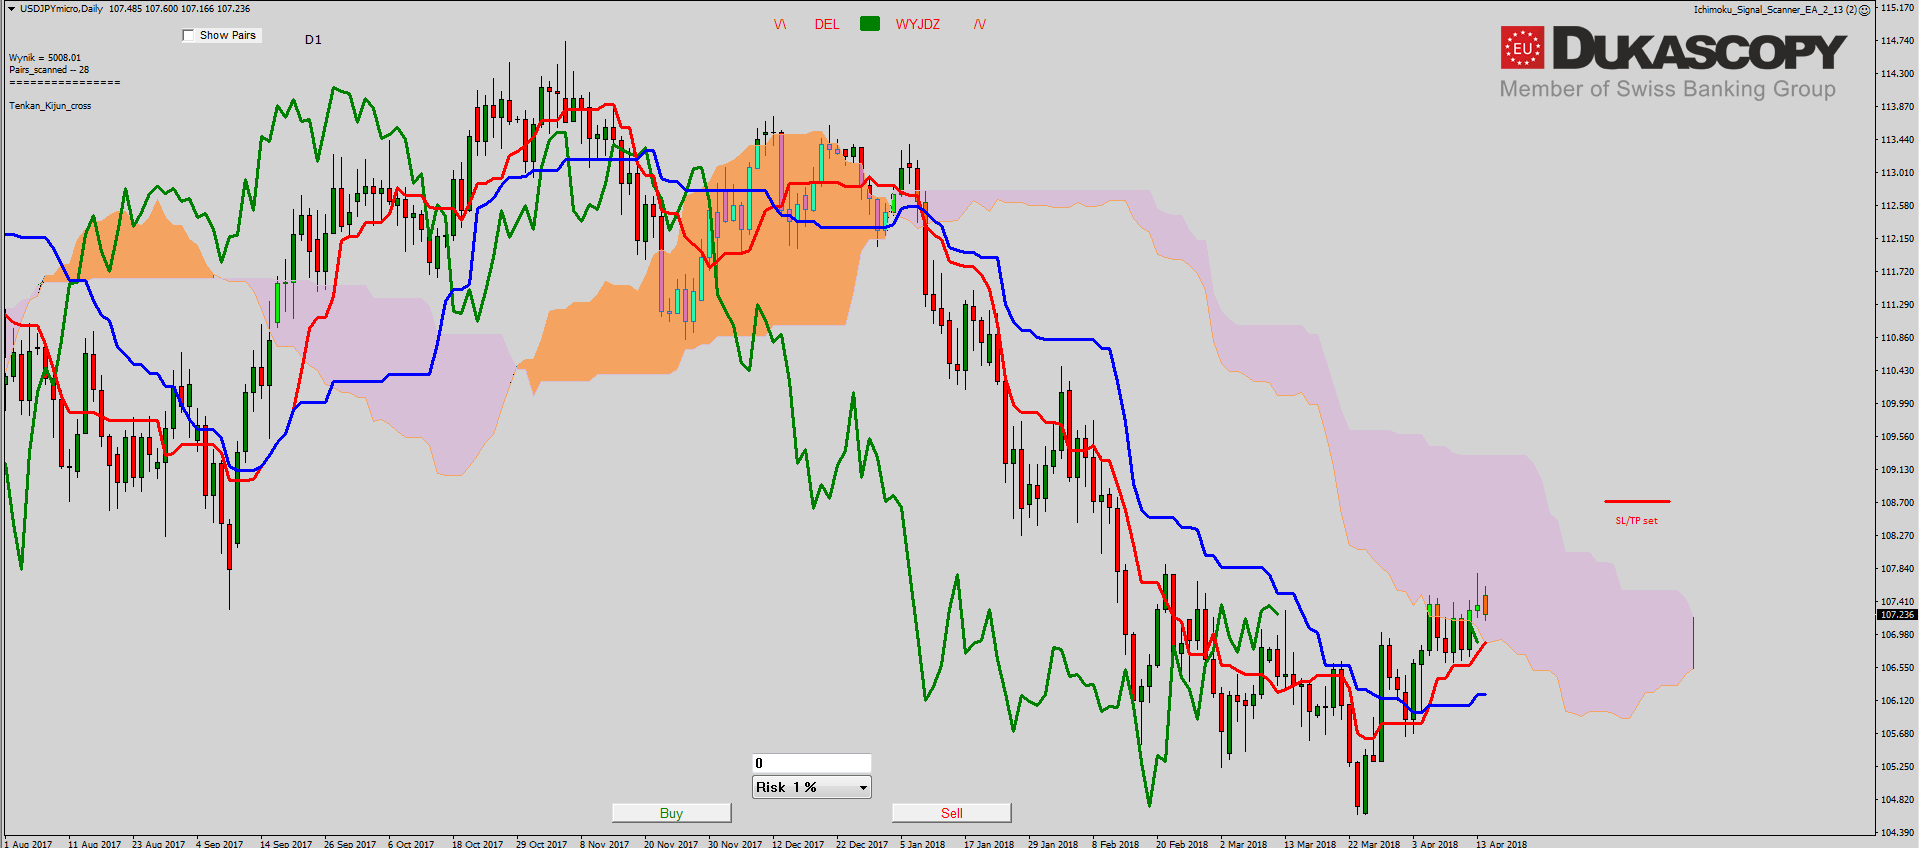
 On the Ichimoku chart, we can see that the pair after the Tenkan re-test dealt with Senkou Span A and found herself in the cloud. Currently, both lines will support the price. The next resistance is only Senkou Span B. The Chikou line approached Tenkan and if the increases are to be continued, it should be overcome. For her, another resistance will be Senkou Span A. Kijun line begins to lay flat and move away from the price and this may cause a desire to correct and decrease towards at least the Tenkan line. Sentiment has leveled out and is neutral, but there are currently no suitable conditions for trade, which is why only observation remains.


