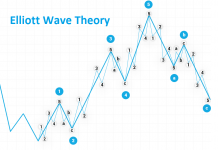
 „Searching, Analysing, Trading” is a series of analyses designed for an investment strategy based on Price Action and Elliott Waves. Its step-by-step description can be found in this link. We kindly invite you to follow our today’s review of selected currency pairs and potential opportunities for transactions.
Our analyses are prepared based on Ducascopy’s SWFX Sentiment Index, available here.
EUR/USD
The pair stays locked between two levels, and only once one of them is breached, will there be space for a bigger move. From the bottom, the pair has once again defended the support zone, located around 1.1550. As I wrote before, the wave that formed following the rejection of the 1.1830 level is a 5 and if it is not wave 5 of the entire move down, continuation should be expected. At present we are witnessing its correction taking for the time being the form of a simple one. The 1.1730 area is the key level for the downward scenario. Once breached, that scenario is negated.
On the Ichimoku chart, the pair keeps defending the Senkou Span A line of the descending MN cloud, preventing the Kijun MN line from being tested. The pair is also struggling with Senkou Span A from the top, but on the remote W1 TF only. Once any of them is breached, a move in a given direction will be triggered. Sentiment keeps changing every now and then and currently it is at a neutral level, which allows us to open positions in any direction. However, I personally decided to refrain from opening a position on this pair and I am waiting until any of those lines is broken, or at least Kinun D1 is breached, which will open a path to a move towards the cloud.
GBP/USD
On the GBP/USD pair chart, we can see that declines, which reached the 1.3050 level, keep rolling on. The level was defended, and the pair returned to the area of the inner line that is being tested. It seems to me all the time that the pair is forming an extended wave 5 and resembles a descending wedge more and more. The 1.3050 level from the bottom and 1.3300 from the top seem to be key for this pair. Once any of them is breached, we can work out a trading scenario.
On the Weekly Ichimoku chart, the pair is still sitting within the cloud and despite several attempts, I can’t tackle the Senkou Span A line. One breached, it opens the way to the 1.3500 level, where Kijun MN is located. On the daily chart, the pair is testing the Tenkan line and once it is breached, Kijun D1 should be tested. Also, in this case I decided to refrain from trading decisions.
The partner of “Search, Analyse, Trade” series is a Dukascopy Europe broker who gives its customers access to ECN accounts in different currencies.
Trade on Forex, indices and commodities thanks to Swiss FX & CFD Marketplace. Open free trading account right now.
JPY/USD
The pair, having retested the support located around the 109.500 level, sped towards the line drawn along the peaks. The line is being tested the result of that test will determine whether the move up will be continued in the long run. From the wave perspective, in one of the scenarios, I assumed the formation of 1212 sequence was taking place. However, the current gains are in no way related to wave 33 – that’s why this scenario will most probably not play out (unless a strong move up occurs from the current levels). All we can do is wait for the result of the test of the trend line and of the resistance line hovering in that area as well.
On the daily Ichimoku chart, we can see that the pair bounced off the Kijun and Senkou Span A lines, which gave rise to two quite interesting buy signals. Currently the pair stopped at the extended Kijun W1 line and only once that level is breached, will a path to continued gains towards Senkou Span A of the descending W1 cloud be open.


