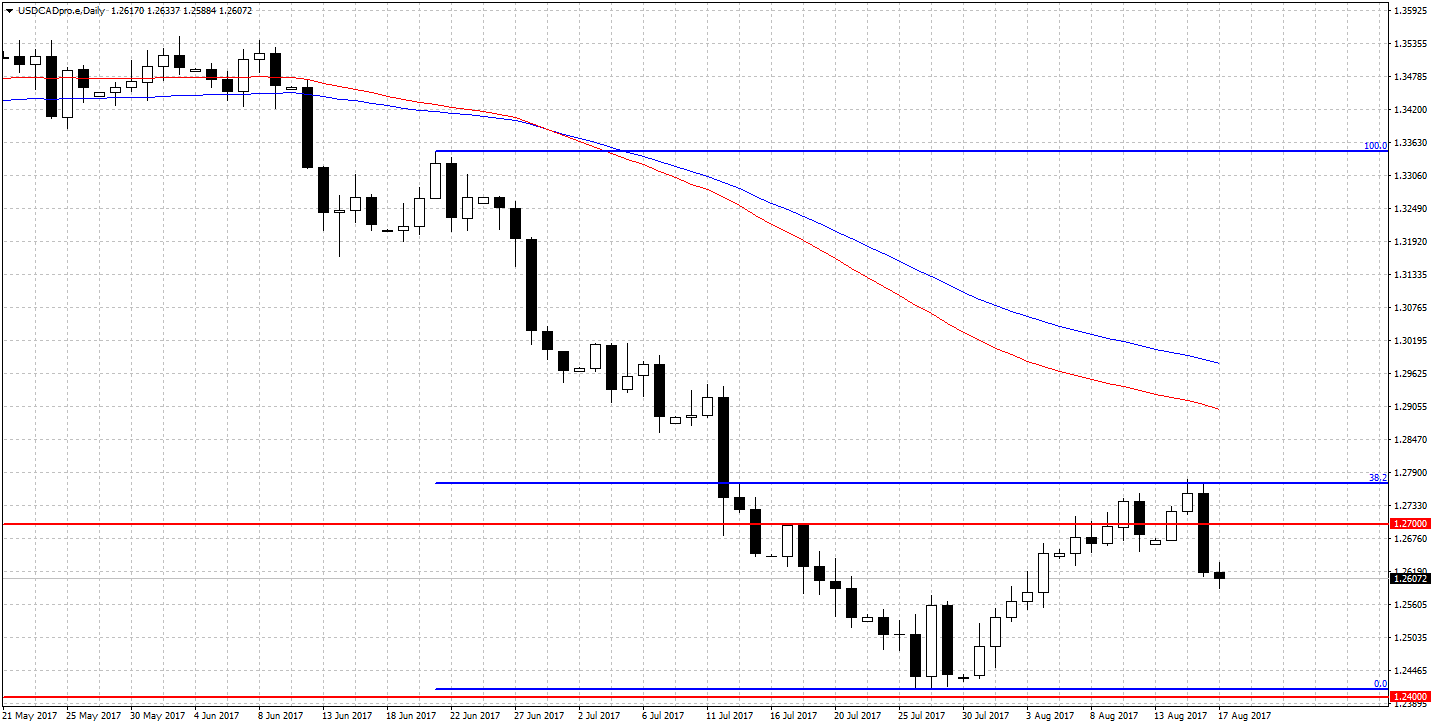
USDCAD daily chart shows slowdowns. It can be seen that support area, at a round level 1.2700 is coinciding with 38.2% FIBO abolition. Zone test led to increased demand response. Currently, there is growing pressure from the sellers. Support is in the vicinity of the previous low at a round level of 1.2400. It’s worth looking on a chart with a lower time interval.
Get access to around 200 financial instruments through Noble Markets >>
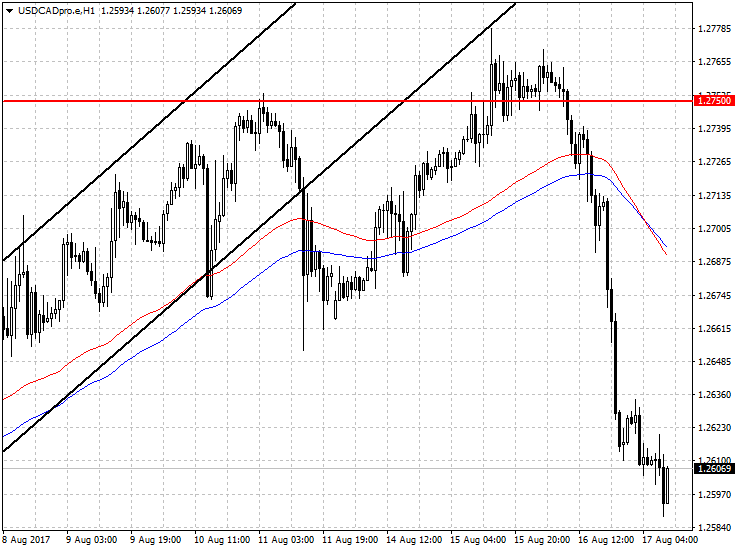
On H1 trading interval pair broke the bottom edge of the growth channel. Test of the previous peak at 1.2750 resulted in an intensified response of supply and takeover of the initiative by the sellers. Currently, quotes are approaching strong support at 1.2550. Probably at this point we will see a rebound to the last sell off.