Moving averages are one of the most often used indicators available to traders.
What average should we choose when we have in principle their infinite amount, because of the number of periods from which they are calculated and the calculation method- simple, exponential, smoothed, linear ?
In this article, I would like to describe exponential moving average EMA144, which I consider very useful for traders.
Why EMA144?
Why not for example 27 or 134 or maybe 49? The answer may be found in a fragment from a book about Jake Bernstein: –
Citing: “The biggest problem in building a Moving Average (MA) investment system is choosing the right number of periods from which they are calculated.” To this puzzle, Jake Bernstein decided to test all possible variants of the moving average From a value of 5 to 200, taking a normal, weighted, smoothed and exponential MA, since the database was very large, he asked for help from NASA specialists because they had the best and fastest computers at that time. The most effective trading signals are: Smooth Moving Average (SMA) – 34 SMA (Smooth Moving Average) – calculated on close prices and exponential moving average of 144 periods – 144 EMA (Exponential Moving Average) calculated at close prices. When Jake Bernstein saw these values, he immediately pointed out that they were numbers from the Fibonacci sequence. He stated, “It has to be – Bingo!“
It was some years ago when I had first contact with this indicator when I was looking for “magic” systems to make money on FX … Then I tested, among other things, a scalping system based on two moving averages EMA144 and EMA169. The system of course was worth as much as 99% of the others, which perfectly cleaned the account from capital. Still, I noticed that the EMA144 quite commonly, in case of Forex – more than 60% of the cases ,behaves like a dynamic line of support or resistance depending on the direction of the trend.
HOW TO USE EMA144?
A good graph worth a thousand words, so I will show on the graphs rules for using this medium
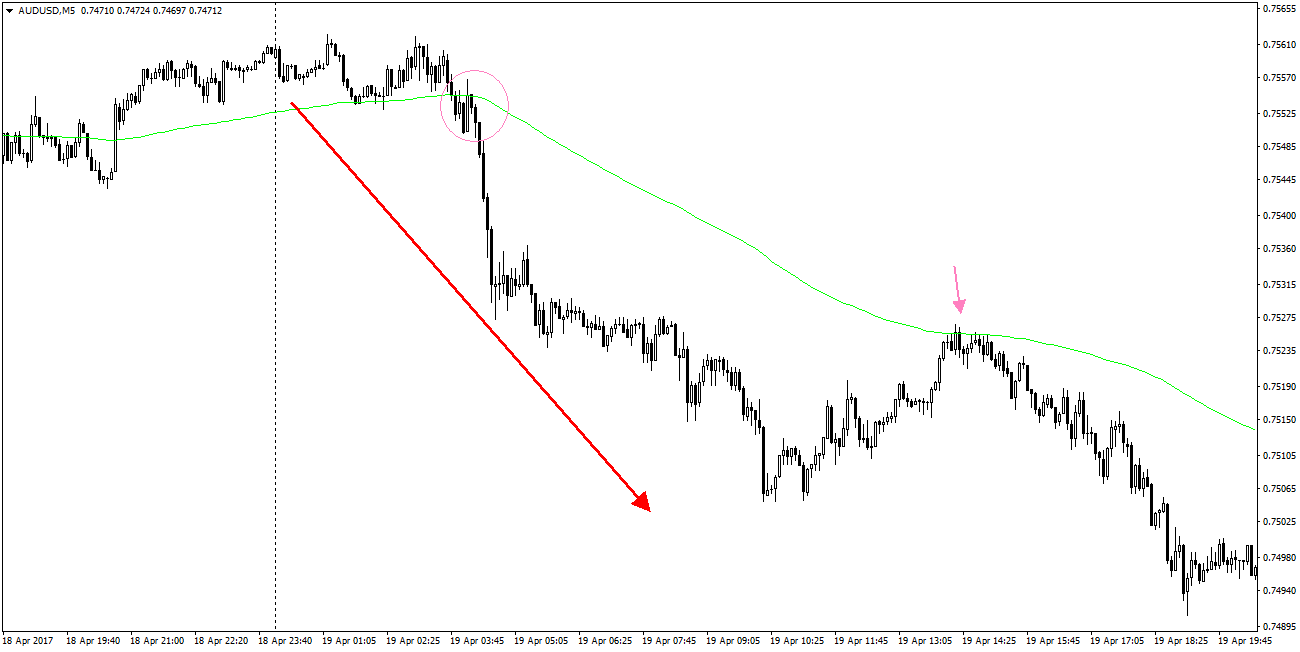
1. AUDUSD M5
The price strikes with high momentum the moving average EMA 144 and the first contact with it is reflected and we see continuation of declines in the direction of breakout (red arrow)
2. USDJPY M5
The same situation – the dynamic EMA 144 and first contact with it results in reflection and movement in line with strike direction.

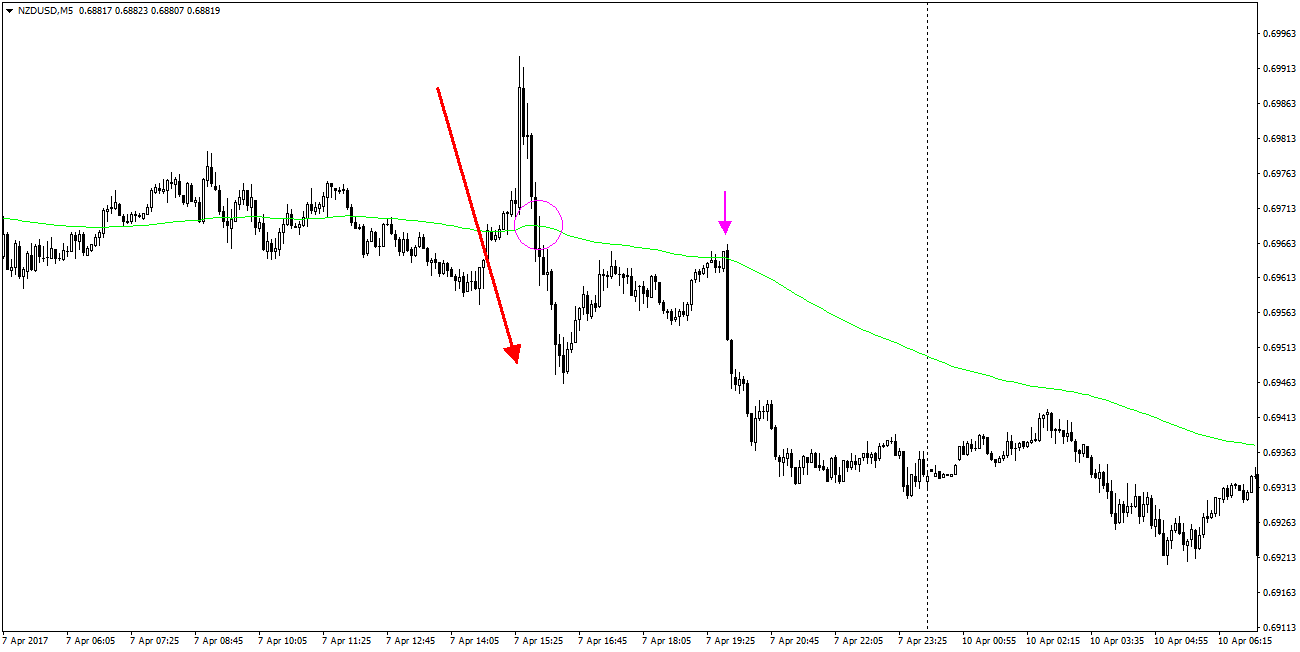
3. NZDUSD M5
The same pattern, worth noting that the more intense is the breaking of EMA 144 the greater is probability of rebounding at first contact with the average.
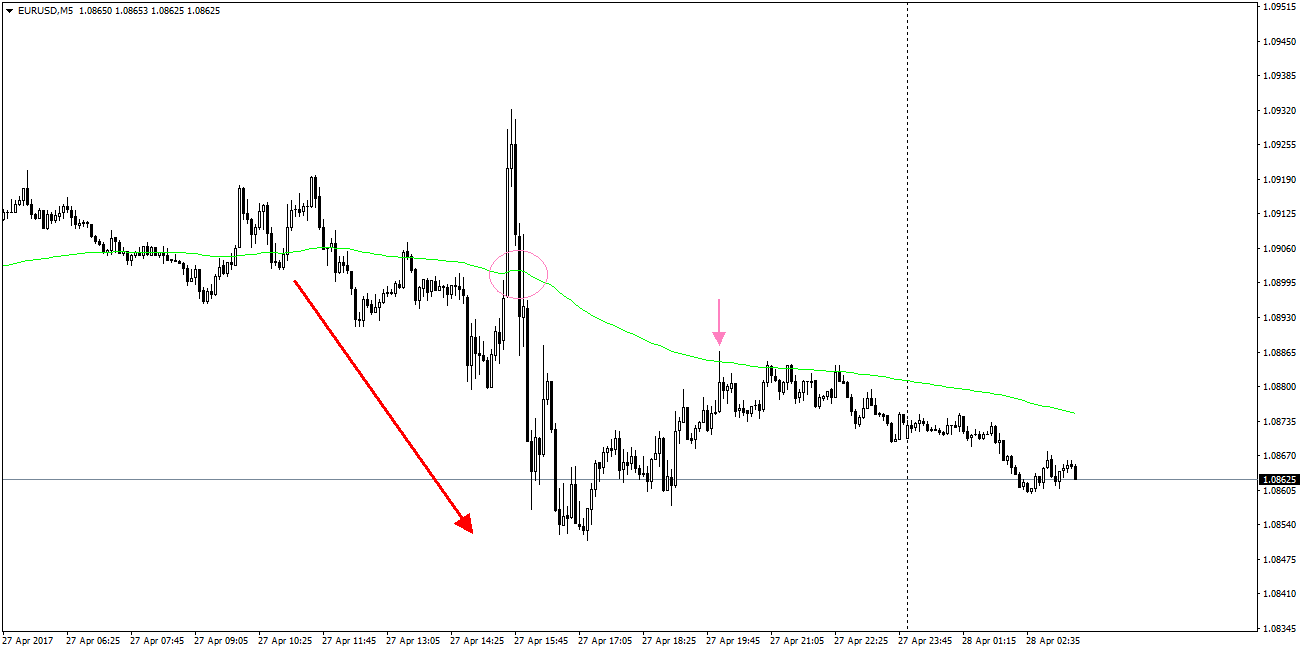
4. EURUSD M5
Here is the latest example from 27.04.2017 – the pair after negating growth and strong downward impulses pierces the 144 EMA and once resistance level is reached returns in a corrective move to EMA144 which becomes a dynamic (moving) resistance.
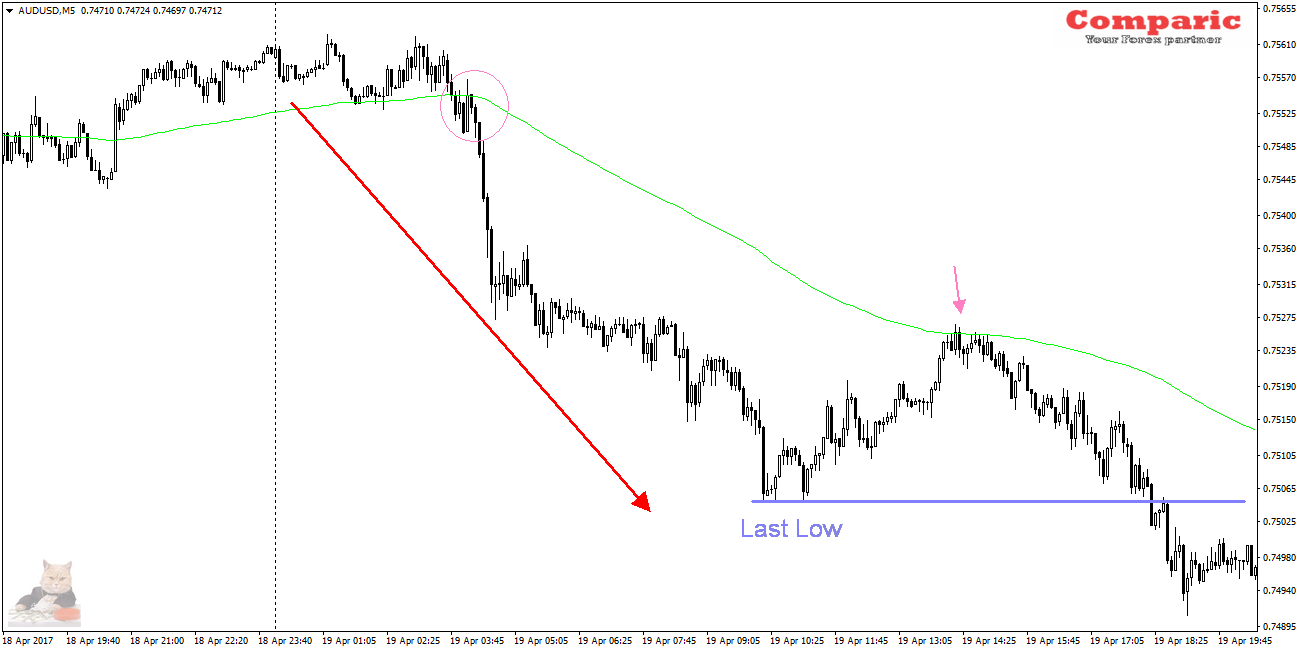
5. AUDUSD M5
Using this indicator we can easily determine trade opening moment and direction – in case of the above examples it will be SELL. In addition what is characteristic for these systems is that the movement following the rebound from the average will usually cross the previous low so we can also estimate the range of move.
And what with higher Time Frames ?
The average is also effective at higher intervals, but of course these situations occur proportionally less often, but in return give bigger move range
As an example may be the following charts EURUSD H4 or EURGBP H1:
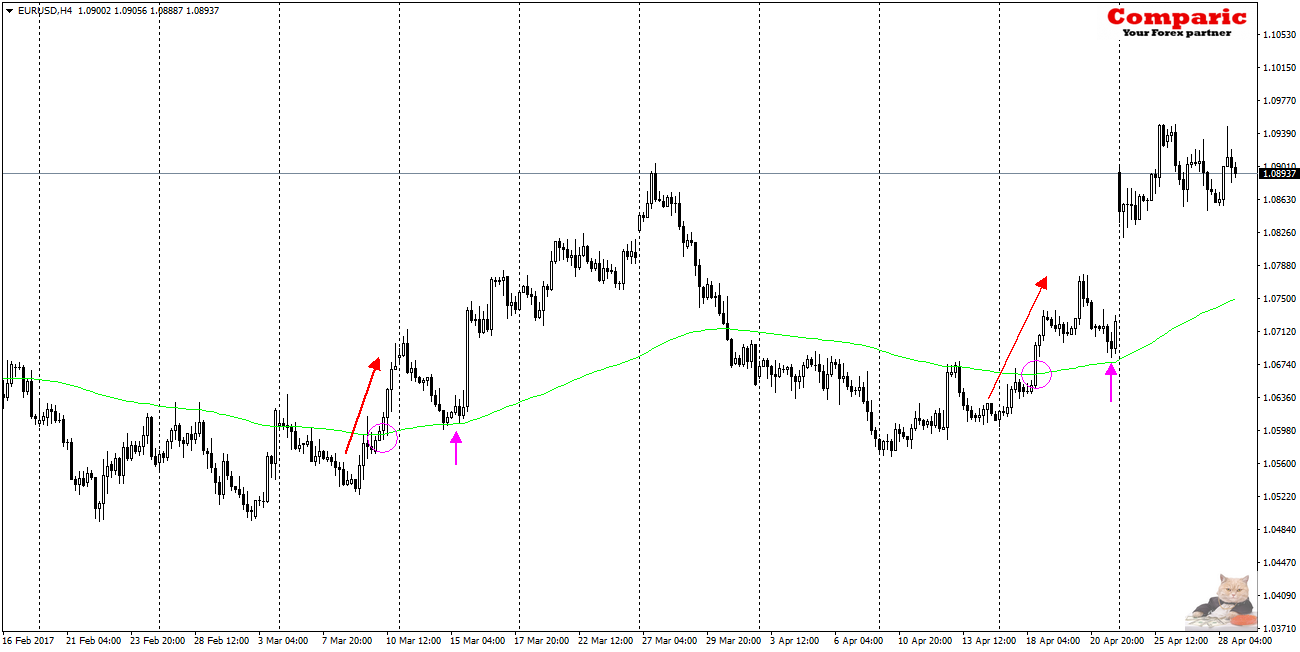
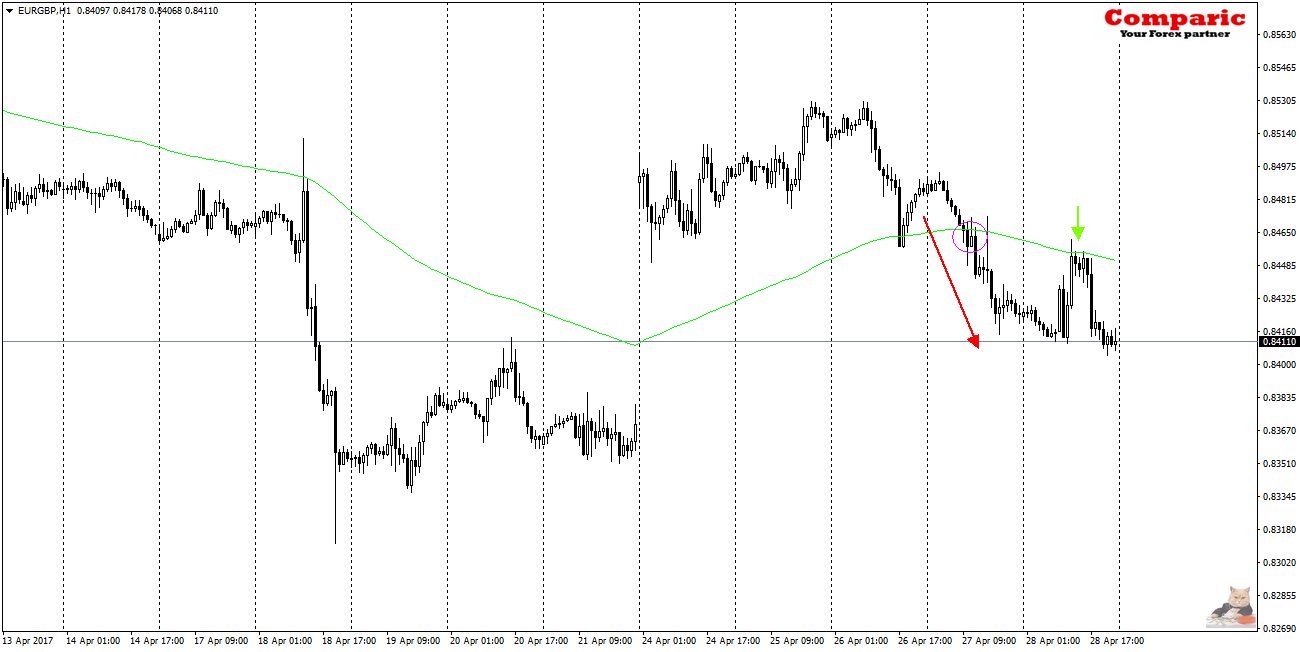
Using the 144 EMA we have some tips on how the price can behave:
• The entry signal is the first contact with the average after its previous breaking – a dynamic breakout is desired.
• Target is at least the level of the last low
• SL depending on the planned TP should be above the last peak but should have a lower value in pips than TP.
Here is an example how to lead a SELL order using the dynamic trend line EMA 144:
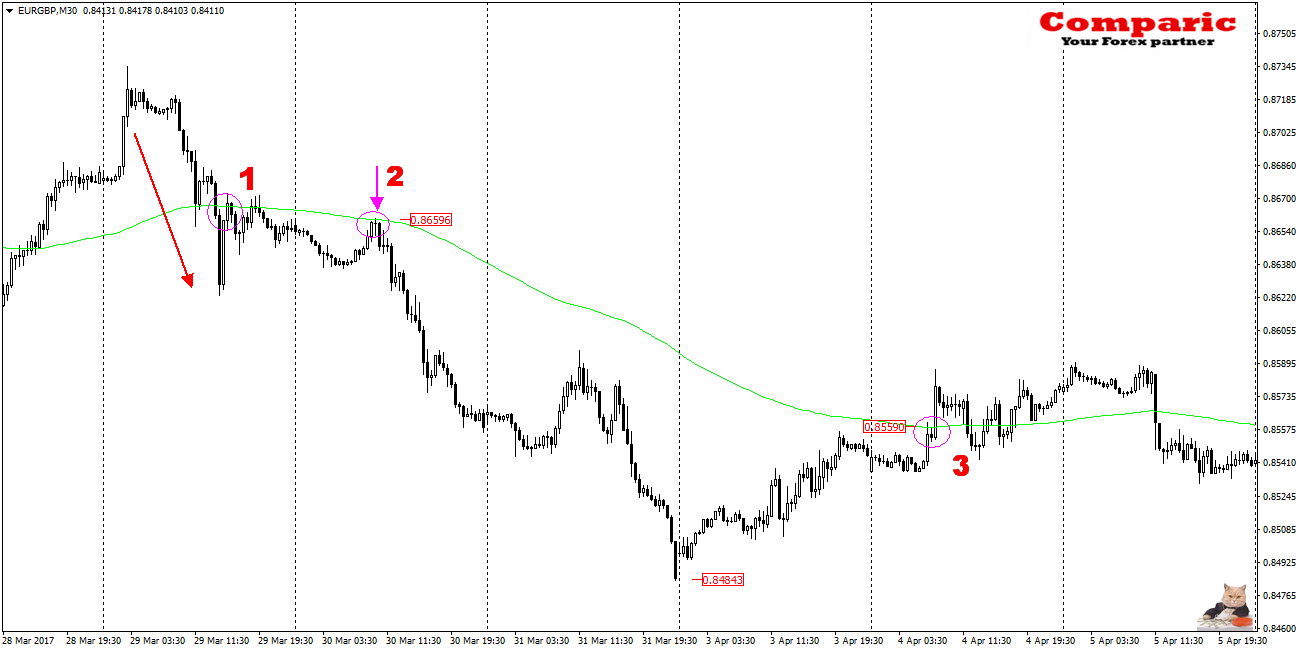
When the price breaks EMA144 with a strong impetus (1), it is the first signal for us that in near future on this instrument may occur interesting us Setup – whan price returns to the EMA144 – (2). When to leave the trade ? It depends on the trader, but not later than when the price starts to break EMA144 (3)
Summarizing :
From my observations, the average EMA 144 is most effective on the M5 and M15 charts, so it is useful for scalpers and daytrading enthusiasts. On the other hand, for the patient trader a good choice will be the average at higher time intervals M30, H1, H4.
Remember that on the Forex market only one thing is sure … that nothing is sure, therefore no indicator or average are infallible, at best they are a bit more effective than 50/50 … giving statistical advantage to the trader and to such in my opinion belongs EMA144.
Of course in this post I placed only basic rules for this strategy, more details ,specially those concerning how to minimize looses I will post in part II, if there will be any interest in the above. Comments welcomed.
Dargo 01.05.17


