Very interesting opportunity to open short position on AUDCHF. Daily chart shows that recently there was a break od bullish trend line. Then there was a re-test of this line and change of trend to bearish what we can see by looking at lower and lower lows and highs. Currently price reached (and slightly broke) resistance in 0.7050 area. In this place yesterday nice Pin Bar showed up. Two moves before also started from classic candle patterns – Engulfing Bar. Additional point for decreases is similar size of last two corrections. It seems like everything is for further losses consistent with current dynamics.
THIS ANALYSIS WAS CREATED IN COOPERATION WITH XM BROKER. OPEN FREE XM ACCOUNT AND GET FREE $30 FOR YOUR TRADING.

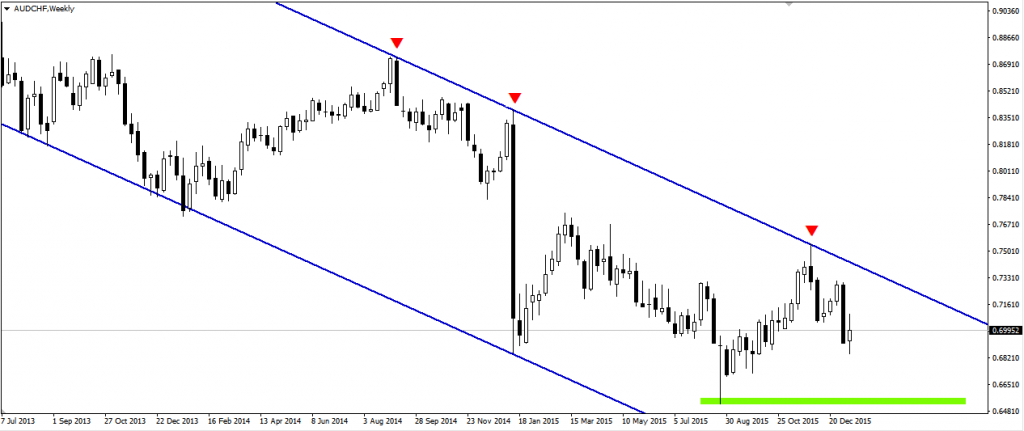
It is also worth to look on the weekly time frame. We can see that there is a lot of space in longer term, we can count that price should reach at least last low, of course if recent sentiment will still be working. Of course we can also play this signal on D1 chart in smaller time frame.