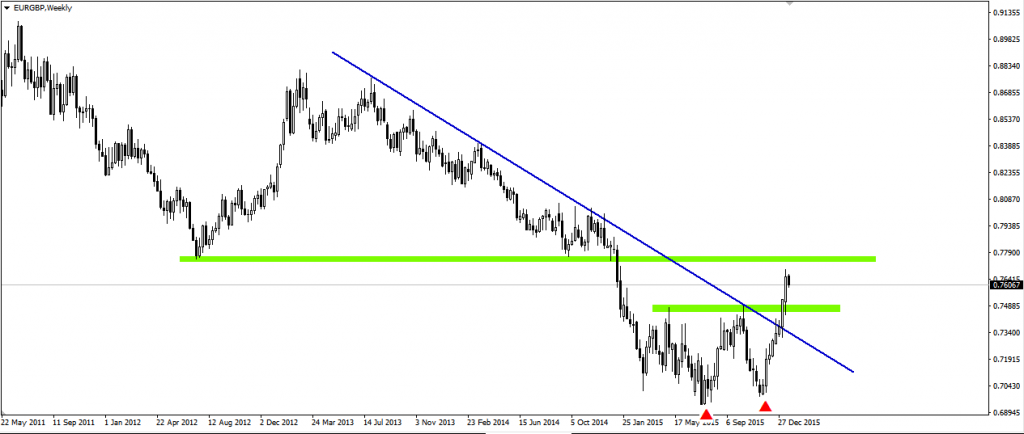
Weekly chart of EURGBP shows some positives. We can see already active double bottom pattern and breaking of bearish trend line. This image predicts continuation of gains, but it seems like we shouldn’t expect more than price reaching to important resistance which is set by last low – 0.7750. It is possible that this is target of current bullish wave.
THIS ANALYSIS WAS CREATED IN COOPERATION WITH XM BROKER. OPEN FREE XM ACCOUNT AND GET FREE $30 FOR YOUR TRADING.
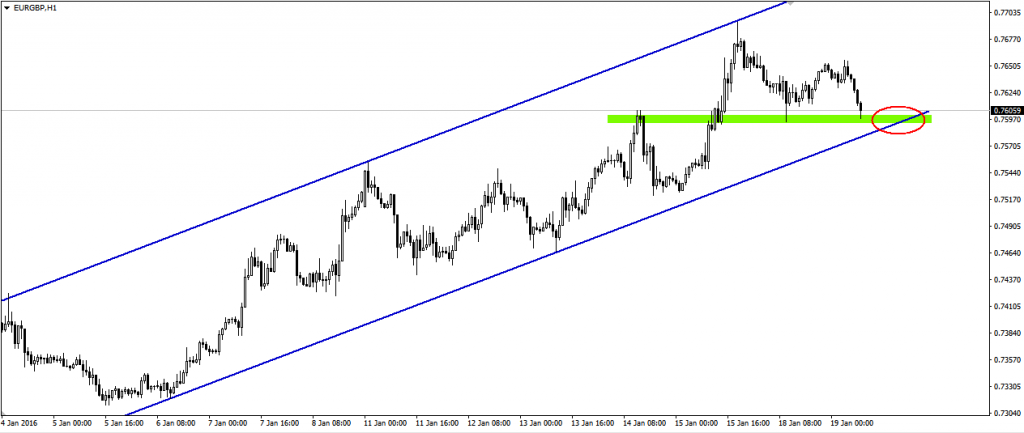
Dynamic bullish trend is perfectly seen on H1 where we can also set borders of it. So strong gains are in power since beginning of this year. Currently we can see a correction which is testing for the second time support in 0.7600 area. It looks like we should look for some bullish signal on H1 or H4 chart. If support will fall and price will leave the channel we can look for another chance on lower levels (0.7525 area) or change our sentiment on this pair.