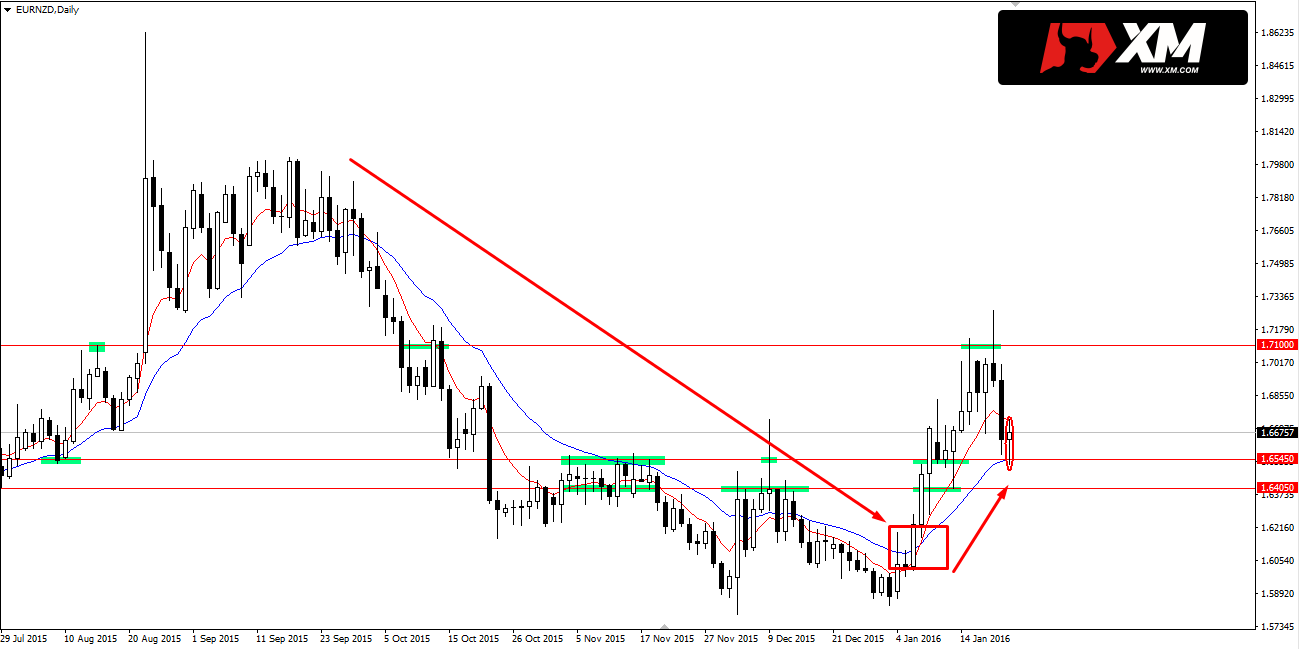
EURNZD after bullish correction lasting since setting top of bullish trend in the end of August 2015, finally came back to gains, what is pointed by crossing 21 days EMA by 8 days EMA.
THIS ANALYSIS WAS CREATED IN COOPERATION WITH XM BROKER. OPEN FREE XM ACCOUNT AND GET FREE $30 FOR YOUR TRADING.
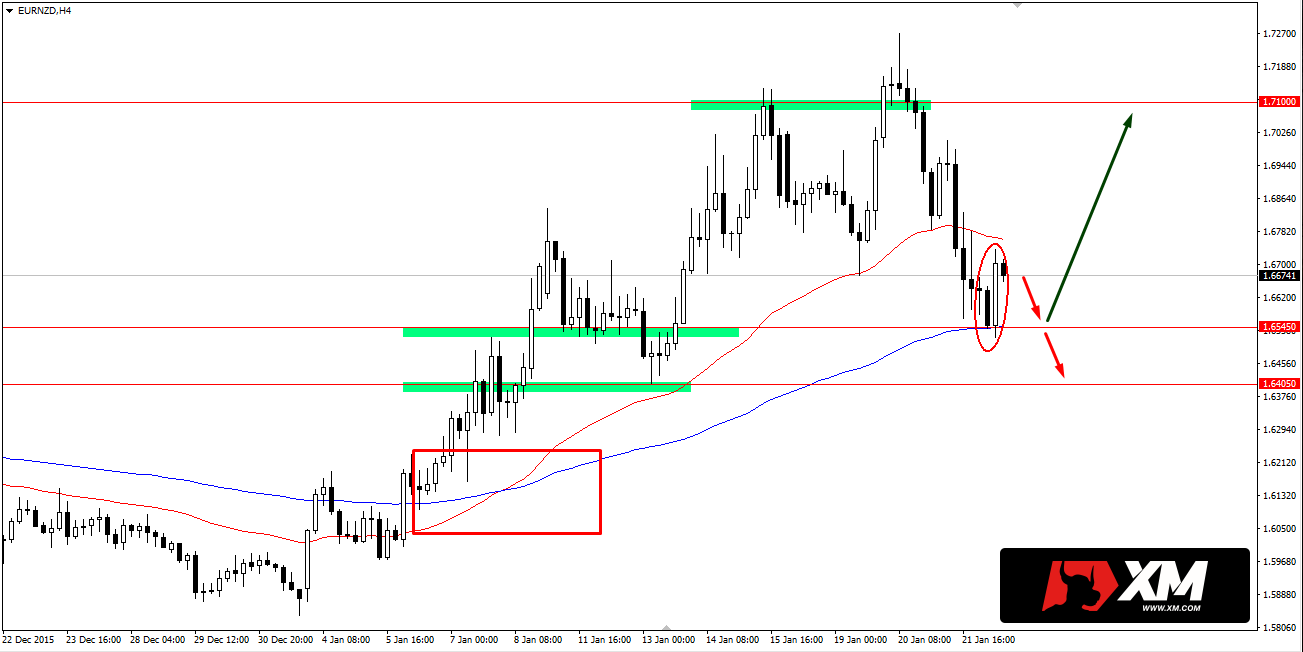
Last bullish trend which lasts since beginning of January was stopped currently after setting new high at 1.7270. EURNZD moved down to support at 1.6545 and on H4 chart we can see Engulfing Bar pattern, or Outside Bar – according to Price Action. This candle engulfs with its range the one before and in this case suggests change of the move. It is also next to important support 1.6545 which worked perfectly earlier not only as a support but also a resistance. If there will be no negation of this pattern it is possible for EURNZD to reach 1.71002 resistance area again.