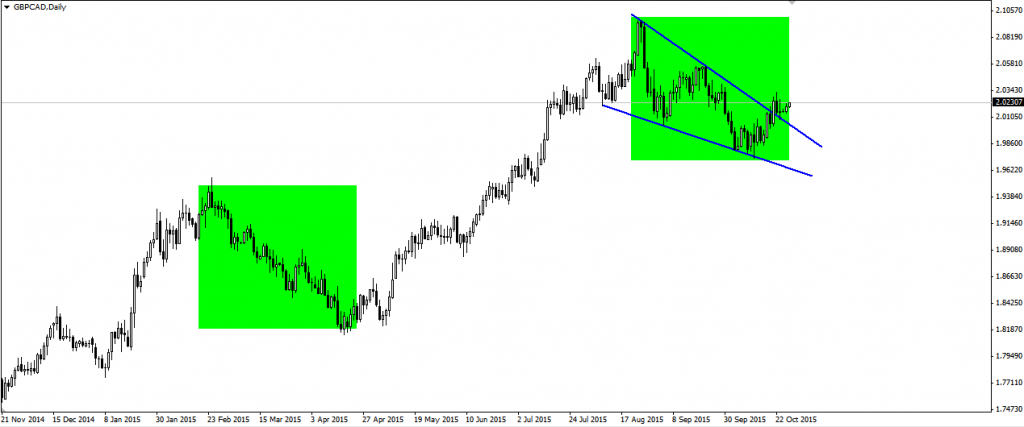
Interesting opportunity to play consistent with the trend can show up on GBPCAD. Wider look, on daily time frame we can see main bullish trend and probably bearish correction ending. Correction reached similar ranged as before (until now the biggest in this trend). It looks like a chance to play long position.
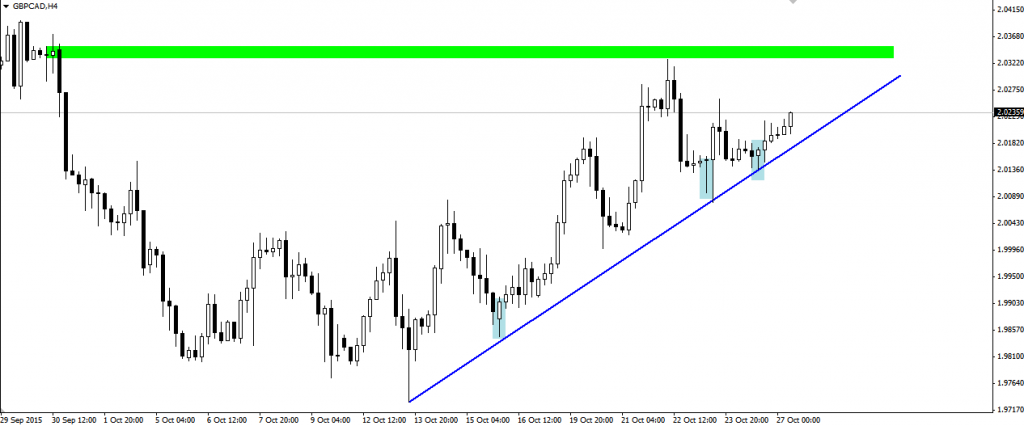
On H4 we can see well respected bullish trend line, it is there since October 13th. Next to it there are bullish candles, the last one was Pin Bar. It looks like next target of bulls will be last top – 2.0330 area. We still have around 100 pips to earn.
THIS ANALYSIS WAS CREATED IN COOPERATION WITH XM BROKER. OPEN FREE XM ACCOUNT AND GET FREE $30 FOR YOUR TRADING.
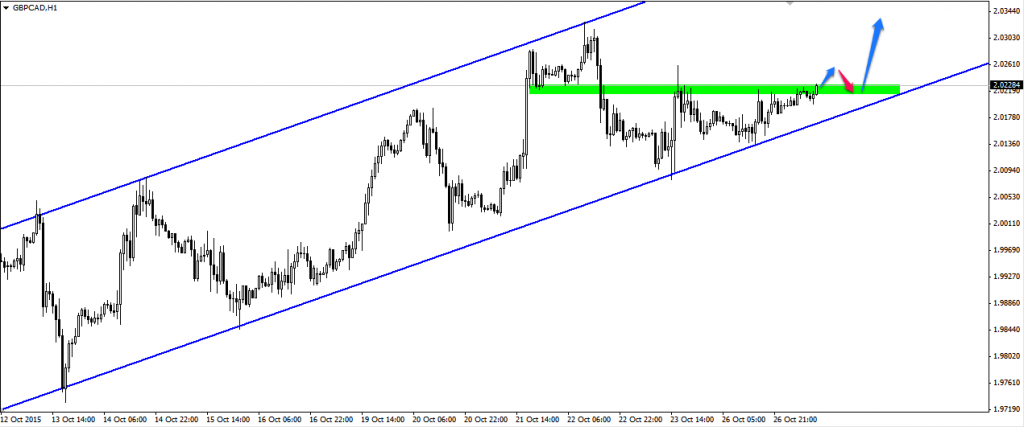
If we want to set precise chance to enter market, we should take a look at H1 chart. We can set here exact bullish channel. Possible scenario for next few hours will be break of local resistance next to 2.0230-40 and its re-test which would end probably next to lower band of channel. If it will happen, we just have to wait for end of correction signal and try to open long position to the level set on H4 chart.


