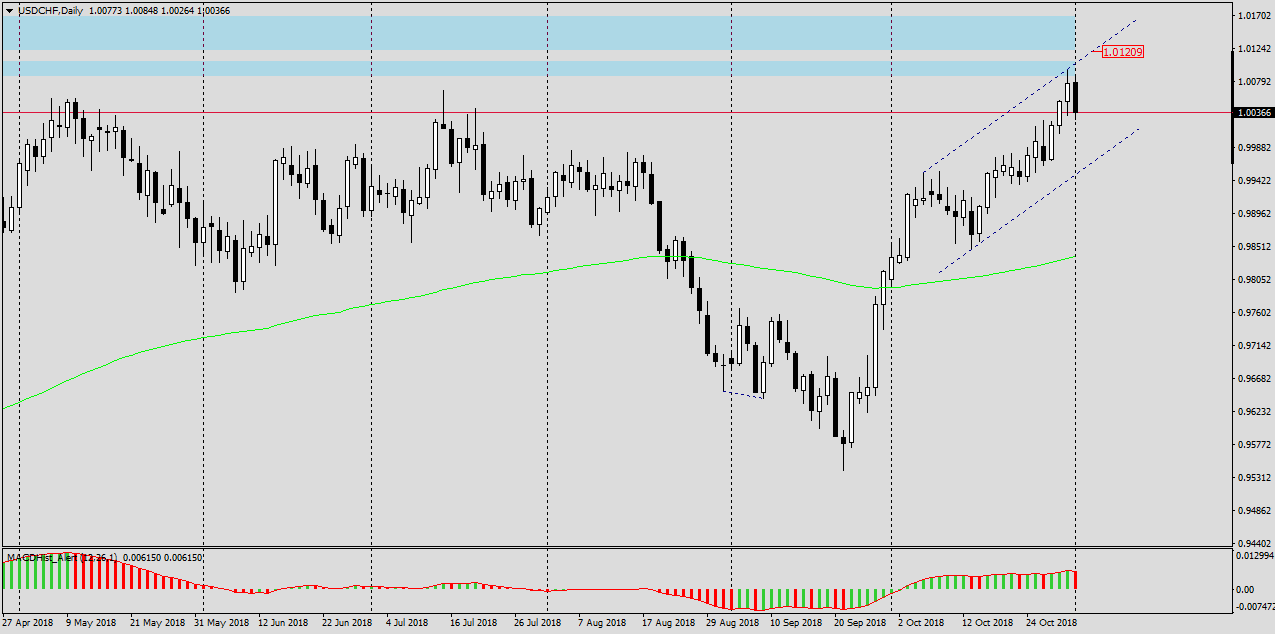
USDCHF – on the last day of October, the pair reached the supply zone created almost 1.5 years ago. The MACD oscillator has reached a maximum today, which we can consider as permanent if the today’s daily candle at the end of the US session (22:00 +1 GMT) will be accompanied by a lower MACD value, frankly – the histogram bar will remain red (lower). On the H4 chart, MACD is already in the declining phase since yesterday.
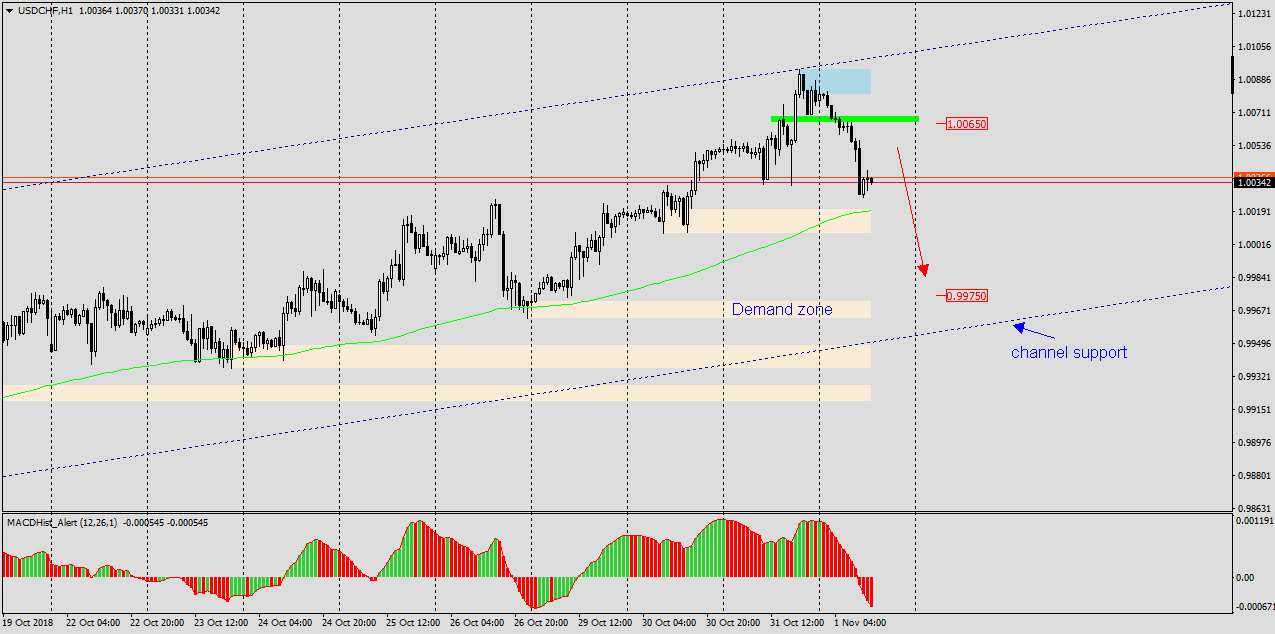
Looking at the H1 chart, we can estimate the potential Stop Loss and Take Profit levels. It seems that the green supply zone around 1.0065 will be a natural local resistance and SL should be above. The target for possible decreases may be the 0.9975-60 demand zone, which will soon coincide with the dynamic support created by the support of the growth channel in which recently the pair is moving (blue dotted line). It is possible that there will be a confluence of supports and there will be a demand response in this place.