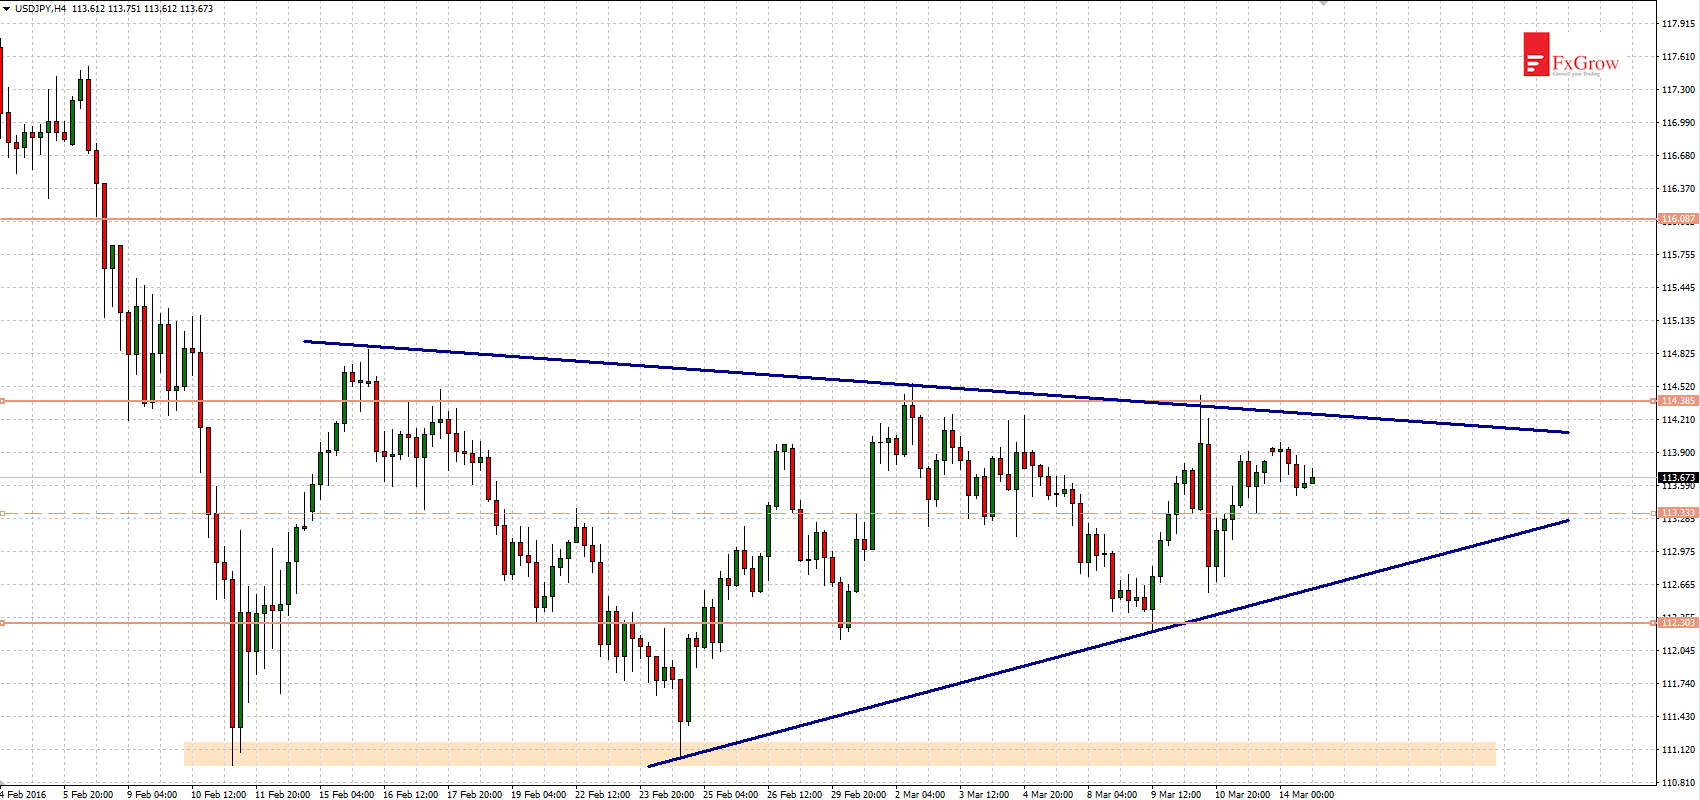
Since February 26 USDJPY is moving in side trend between levels 112.30 – 114.40. It has to be noted that volatility is decreasing and at time-frame H4 triangle pattern occurred. Currently lower limit of the triangle should be found at 112.60 and upper limit at 114.30. After breaking one of indicated levels, dynamic movement is expected.

However, we should be careful – currency pairs with Japanese yen like to have first breakout fakey (false breakout). Nearest supports: 113.30, 112.30, 111.10, nearest resistances: 114.40, 116.00.

Time-frame H1

USDJPY_H1

Try FX GROW. Spread from 0.00001 also STP/ECN execution, full transparency. FxGrow launches new feature packed Website with technical analysis and economic calendar.

Time-frame H4

USDJPY_H4

Error, group does not exist! Check your syntax! (ID: 3)
SHARE
Previous articleGBPUSD below important resistance
Next articleSILVER (H4): Close to previous low
Author of worldtrader.pl blog and big supporter of technical analysis. Active medium-term trader. In his analysis uses classical charts, price action as well as harmonic patterns and Elliott Waves. In trading he always tries to take into account two points of market's view, in accordance with the principle that each transaction may be attractive both for the demand and supply traders.