Wide View Strategy (WiViSt) is a typical trend following strategy. Purpose of this strategy is enter in transaction at the end of correction which is identified in strong trend (uptrend or downtrend). There are two intervals used in this strategy: m30 and m15. 

READ THE FULL DESCRIPTION HERE

EURUSD

WYKRES1

Yesterday’s US CPI data strengthened the US dollar. To full optimism, we need a positive data of industrial production. The publication of these data will occur today at 15:15 CET. On M30 chart averages begun accelerate.

wykres2

Buy opportunity will occur, when %R come above -20. Nevertheless, we have to remember about todays data .

EURGBP

wykres3

Euro began to depreciate what we can observe on M30 chart on EURGBP.

wykres4

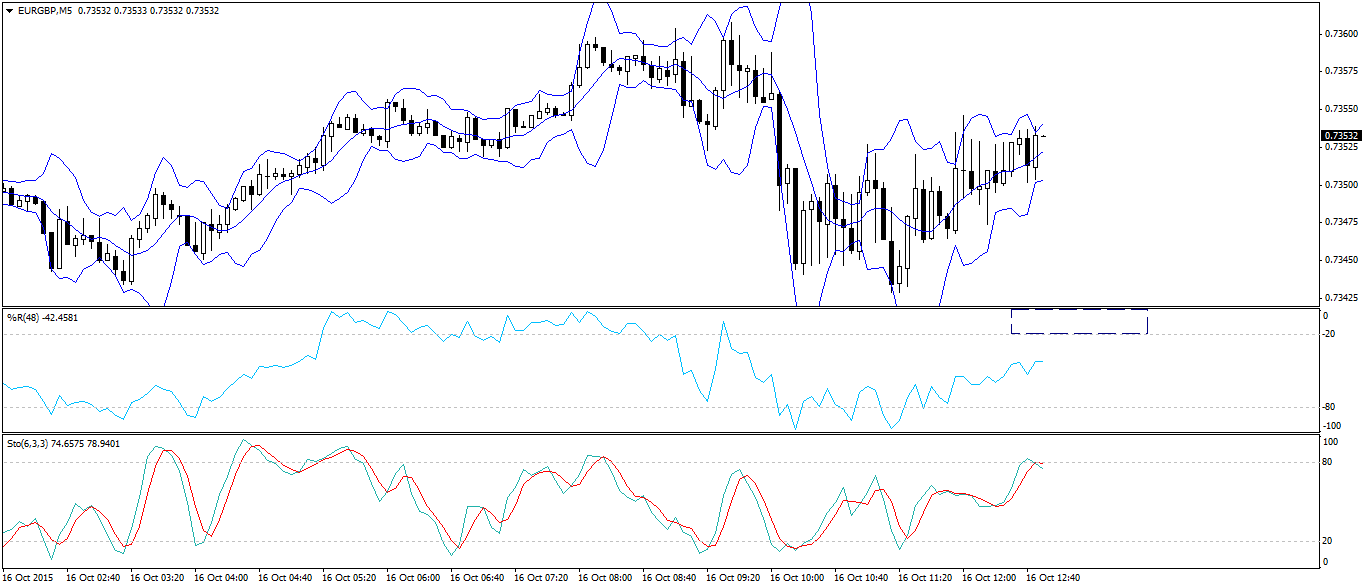
Now we wait for %R to come in to the overvalued area on M5 chart.

Alcoa

wykres5

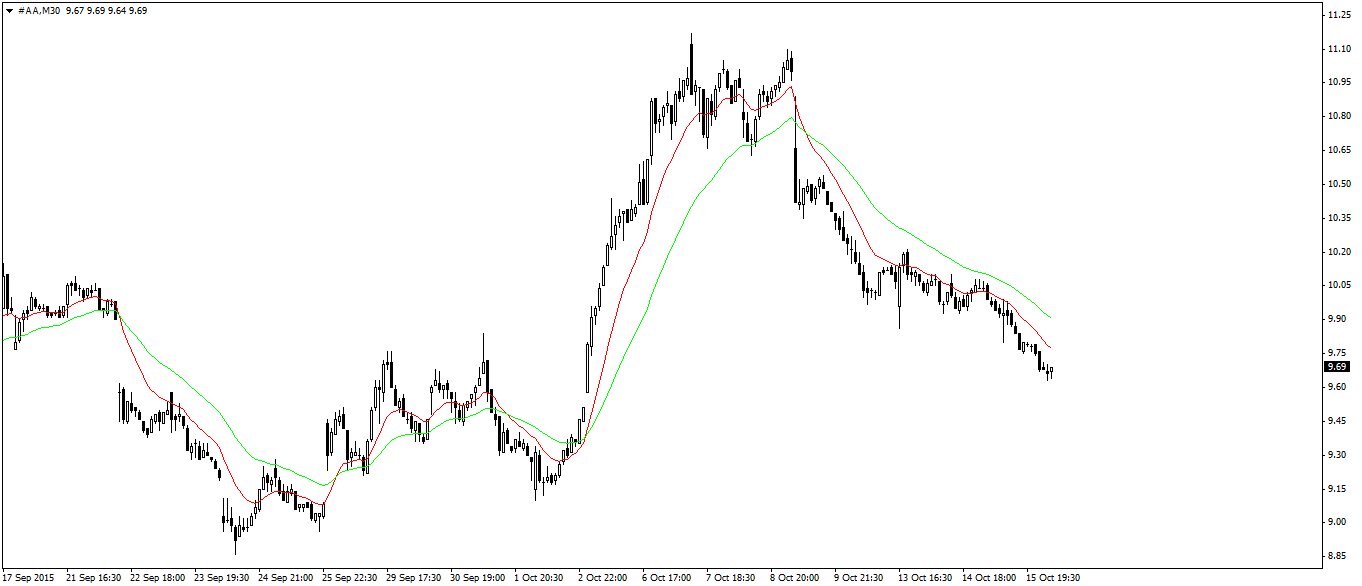
The biggest aluminum producer falls as we can see on M30 chart. It looks like sell potential.

wykres6

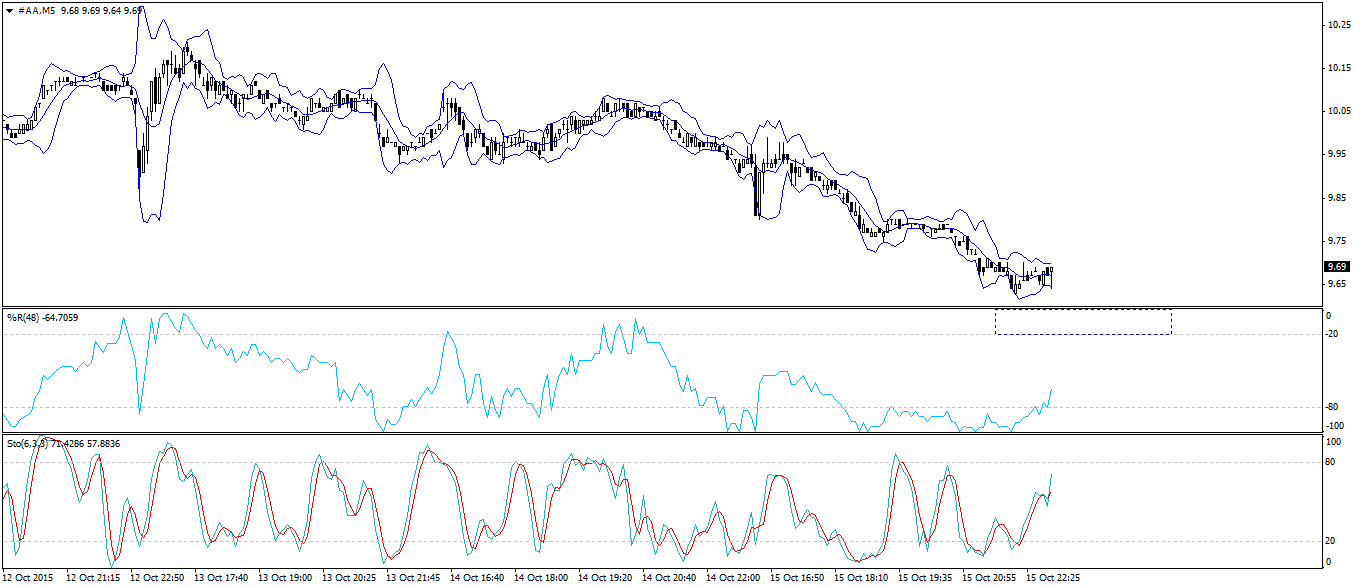
When US market will be open, we can look for sell opportunities. But first, %R has to come above -20.

Error, group does not exist! Check your syntax! (ID: 3)
SHARE
Previous articleUSDCAD – approached the major support at 1.2800
Next articleAUDJPY (intraday) false breakout from consolidation
He gained his investing and financial knowledge due to economic studies – and the practical application of them was possible thanks to Warsaw Stock Exchange (GPW). Participant of trade on world’s major stock markets – NYSE, NASDAQ and LSE. Commodities futures specialist, notably when it comes to WTI oil and gold. Author of Wide View Strategy (WiViSt) which was developed in accordance with the phrase “cut losses quickly, let the profit grow”. A huge supporter of technical analysis – success in investment gives him a calm approach to analyzing charts combined with iron hard rules of capital management. During his financial markets career he shared his experience with traders of one of the largest Forex brokerages in the world.