Wide View Strategy (WiViSt) is a typical trend following strategy. Purpose of this strategy is enter in transaction at the end of correction which is identified in strong trend (uptrend or downtrend). There are two intervals used in this strategy: m30 and m15. 
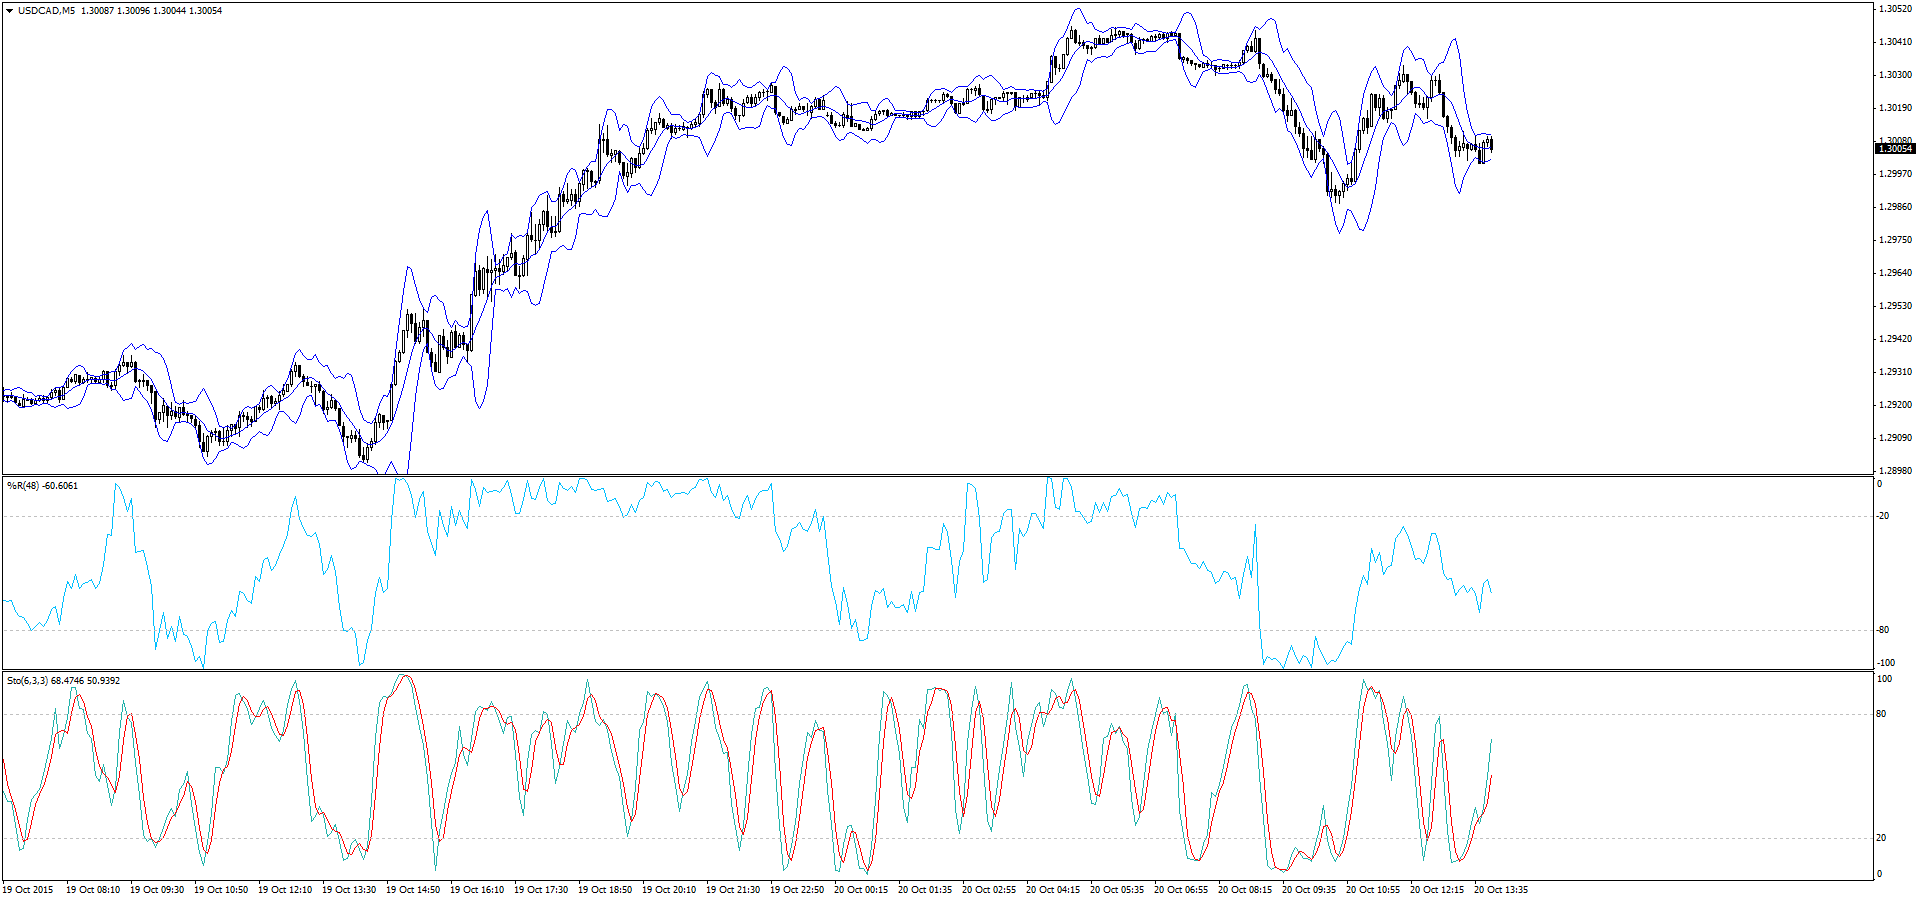
READ THE FULL DESCRIPTION HERE

USDCAD:

wykres1 (3)

Lately US dollar is depreciating. Still we don’t know if FED will raise interest rate. Today we have US Api Weekly Oil Stock data. Today also Janet Yellen will be speaking. USDCAD is worth to observe, consider the fact that oil is highly correlated to Canadian dollar. On M30 chart we can observe strong uptrend. On M5 chart, buy opportunity will occur when %R come to undervalue area.
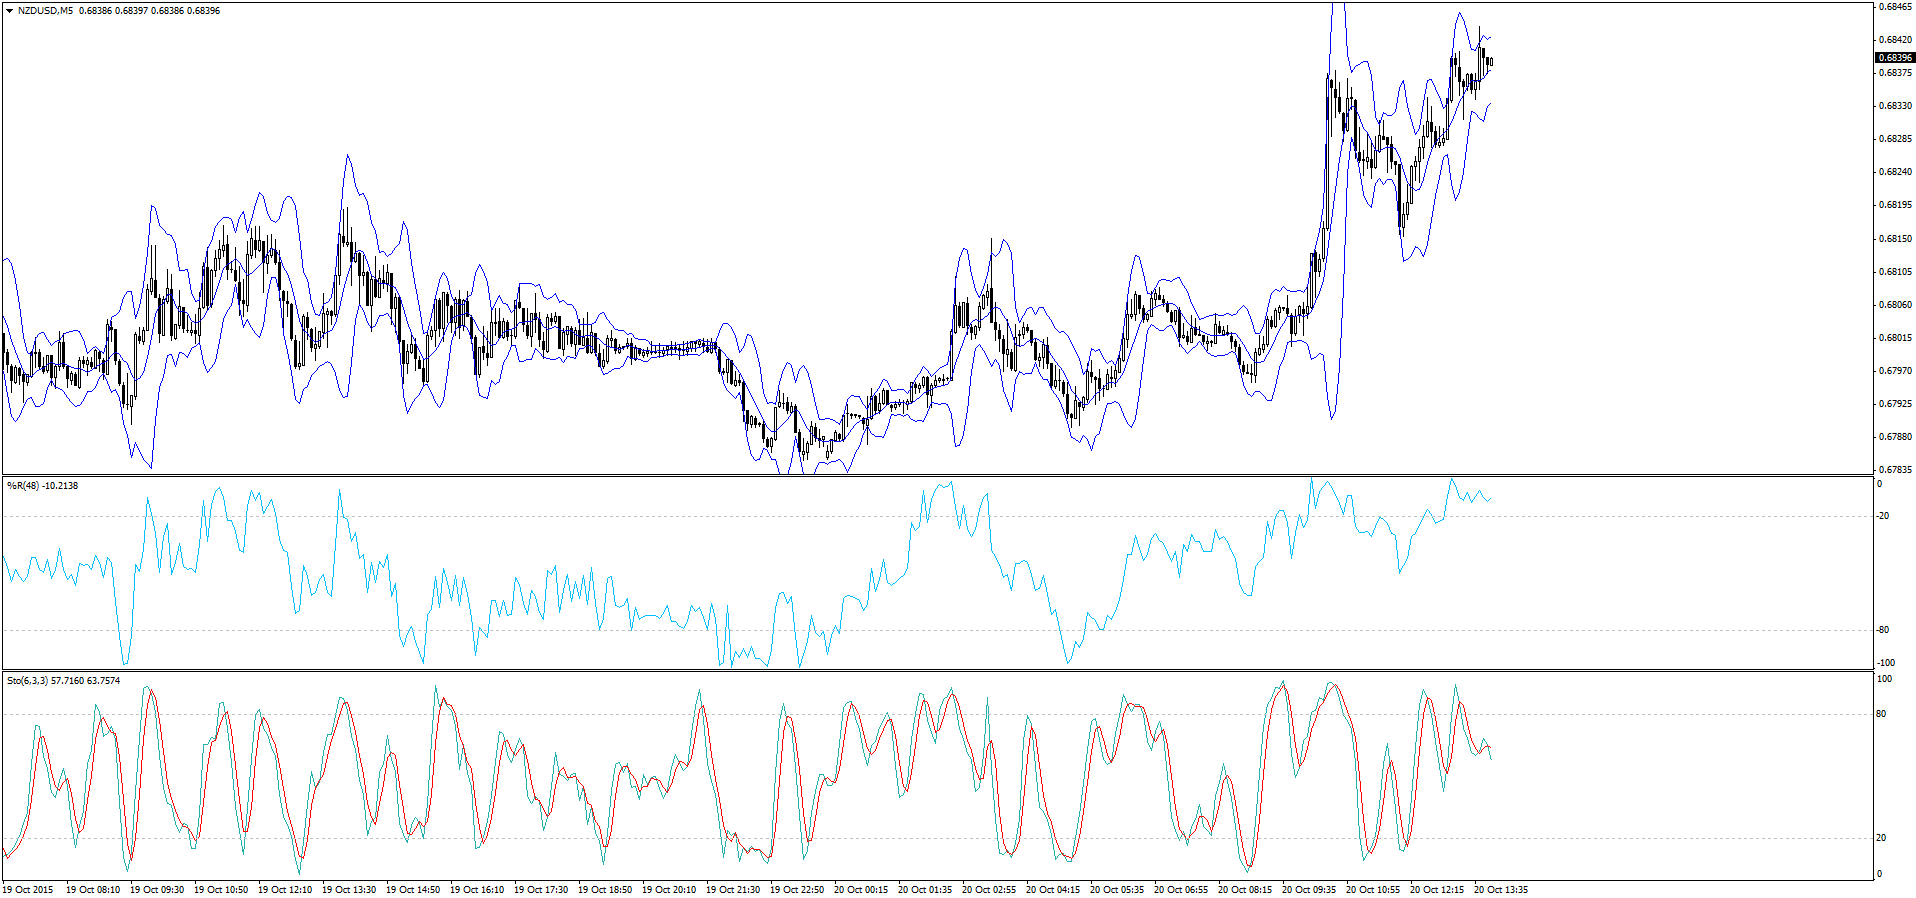
wykres2 (3)

NZDUSD:

wykres3 (3)

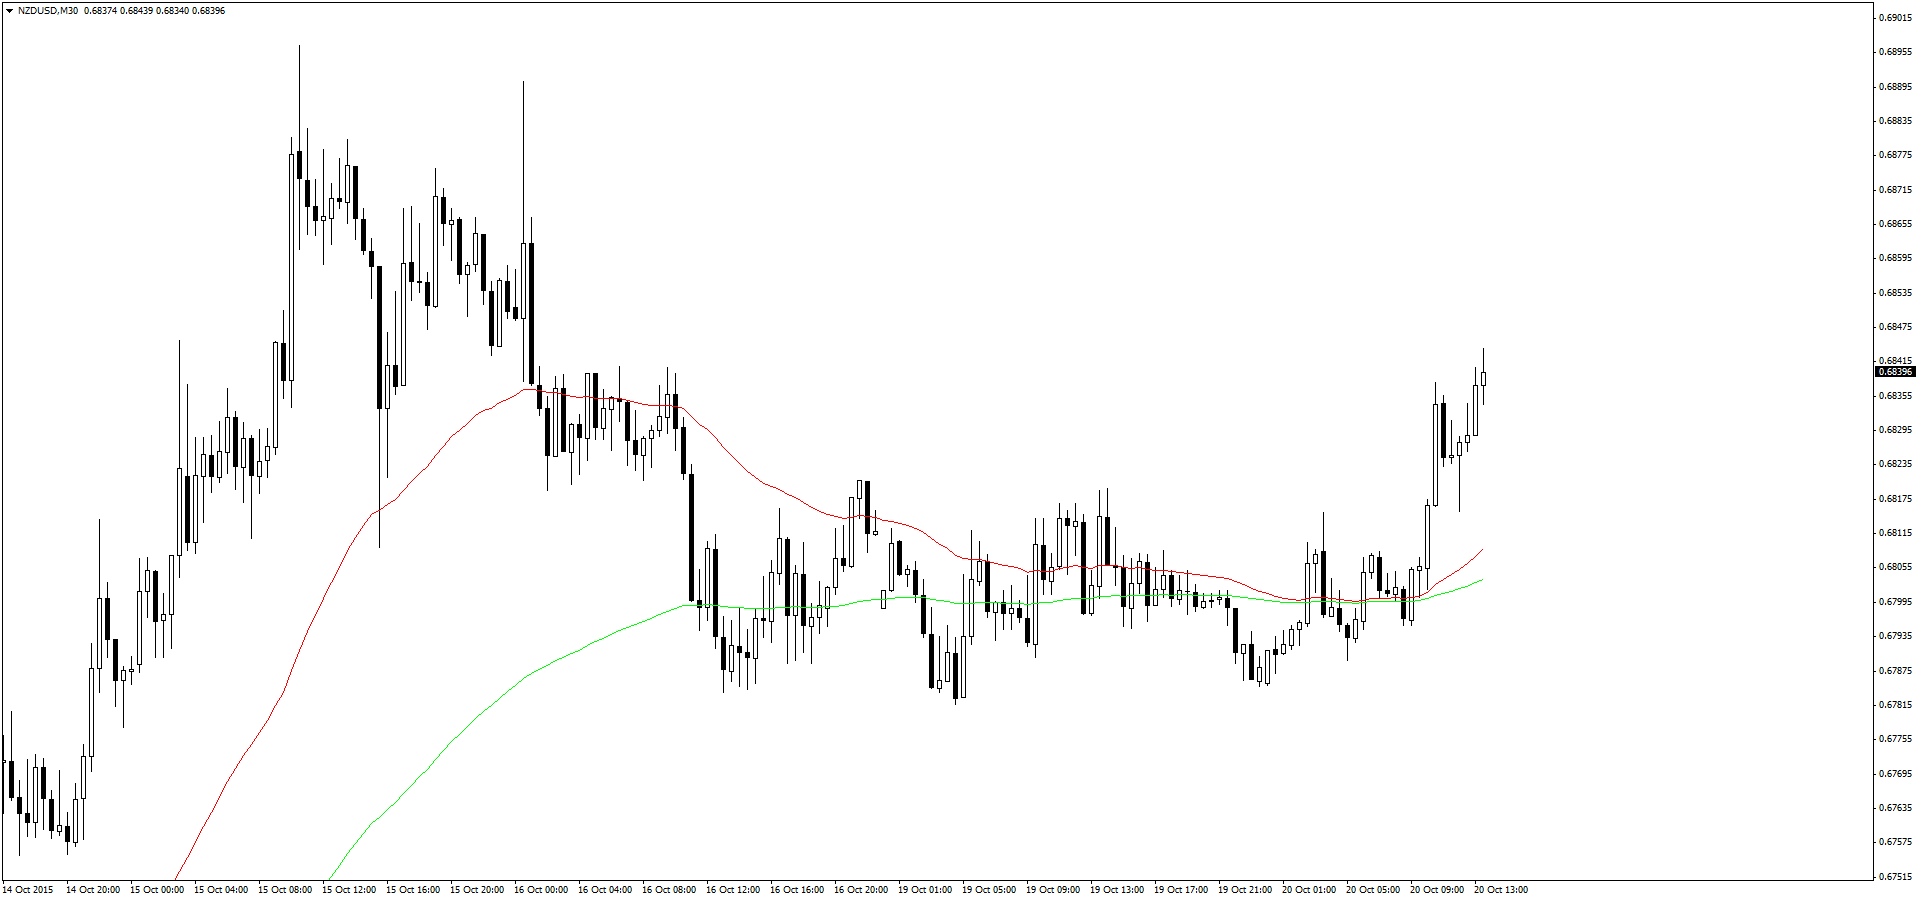
Today important data for New Zealand dollar will be GDT Price Index. As we know milk is one of the most important export product. On M30 chart we can observe that averages are accelerating. On M5 chart we wait until %R will come to undervalued area. Then we will look for buy opportunity.

wykres4 (3)

Error, group does not exist! Check your syntax! (ID: 3)
SHARE
Previous articleEURUSD movement in the channel until Thursday?
Next articleGBPCAD – break above upper limit of consolidation, however correction may be unfinished
He gained his investing and financial knowledge due to economic studies – and the practical application of them was possible thanks to Warsaw Stock Exchange (GPW). Participant of trade on world’s major stock markets – NYSE, NASDAQ and LSE. Commodities futures specialist, notably when it comes to WTI oil and gold. Author of Wide View Strategy (WiViSt) which was developed in accordance with the phrase “cut losses quickly, let the profit grow”. A huge supporter of technical analysis – success in investment gives him a calm approach to analyzing charts combined with iron hard rules of capital management. During his financial markets career he shared his experience with traders of one of the largest Forex brokerages in the world.