On the chart H1 OIL.WTI price follows an upward trend, as evidenced by the sequence of lows and highs. Another tool to help define trend are the moving averages EMA scale H1 (75- and 100-periodic), which are directed upwards.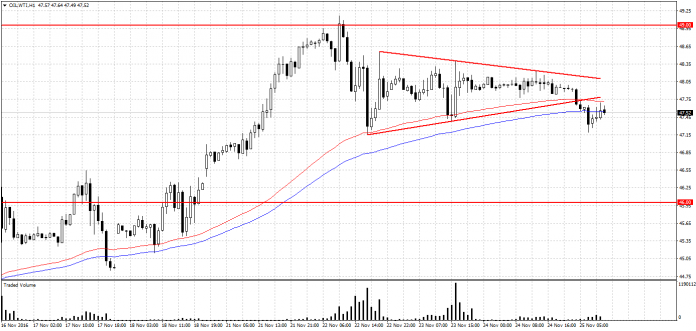
Currently, we see that the price got out from the triangle formation breaking the bottom but this was not associated with significantly higher volumes, it may suggest a false breakout. The emergence of demand and increases in conjunction with the increasing real volume will likely lead to a test of resistance at the psychological level of 49.00 USD. Strong support is round the level of 46.00 USD.


