 The Emini tested yesterday’s high and the August 28 double top with September 9 and pulled back sharply. The bears saw an expanding triangle top with the final hour of yesterday, but the rally on the open was strong enough so that the bears will probably need either a 2nd entry sell signal or a strong breakout below the opening low before they can take control.
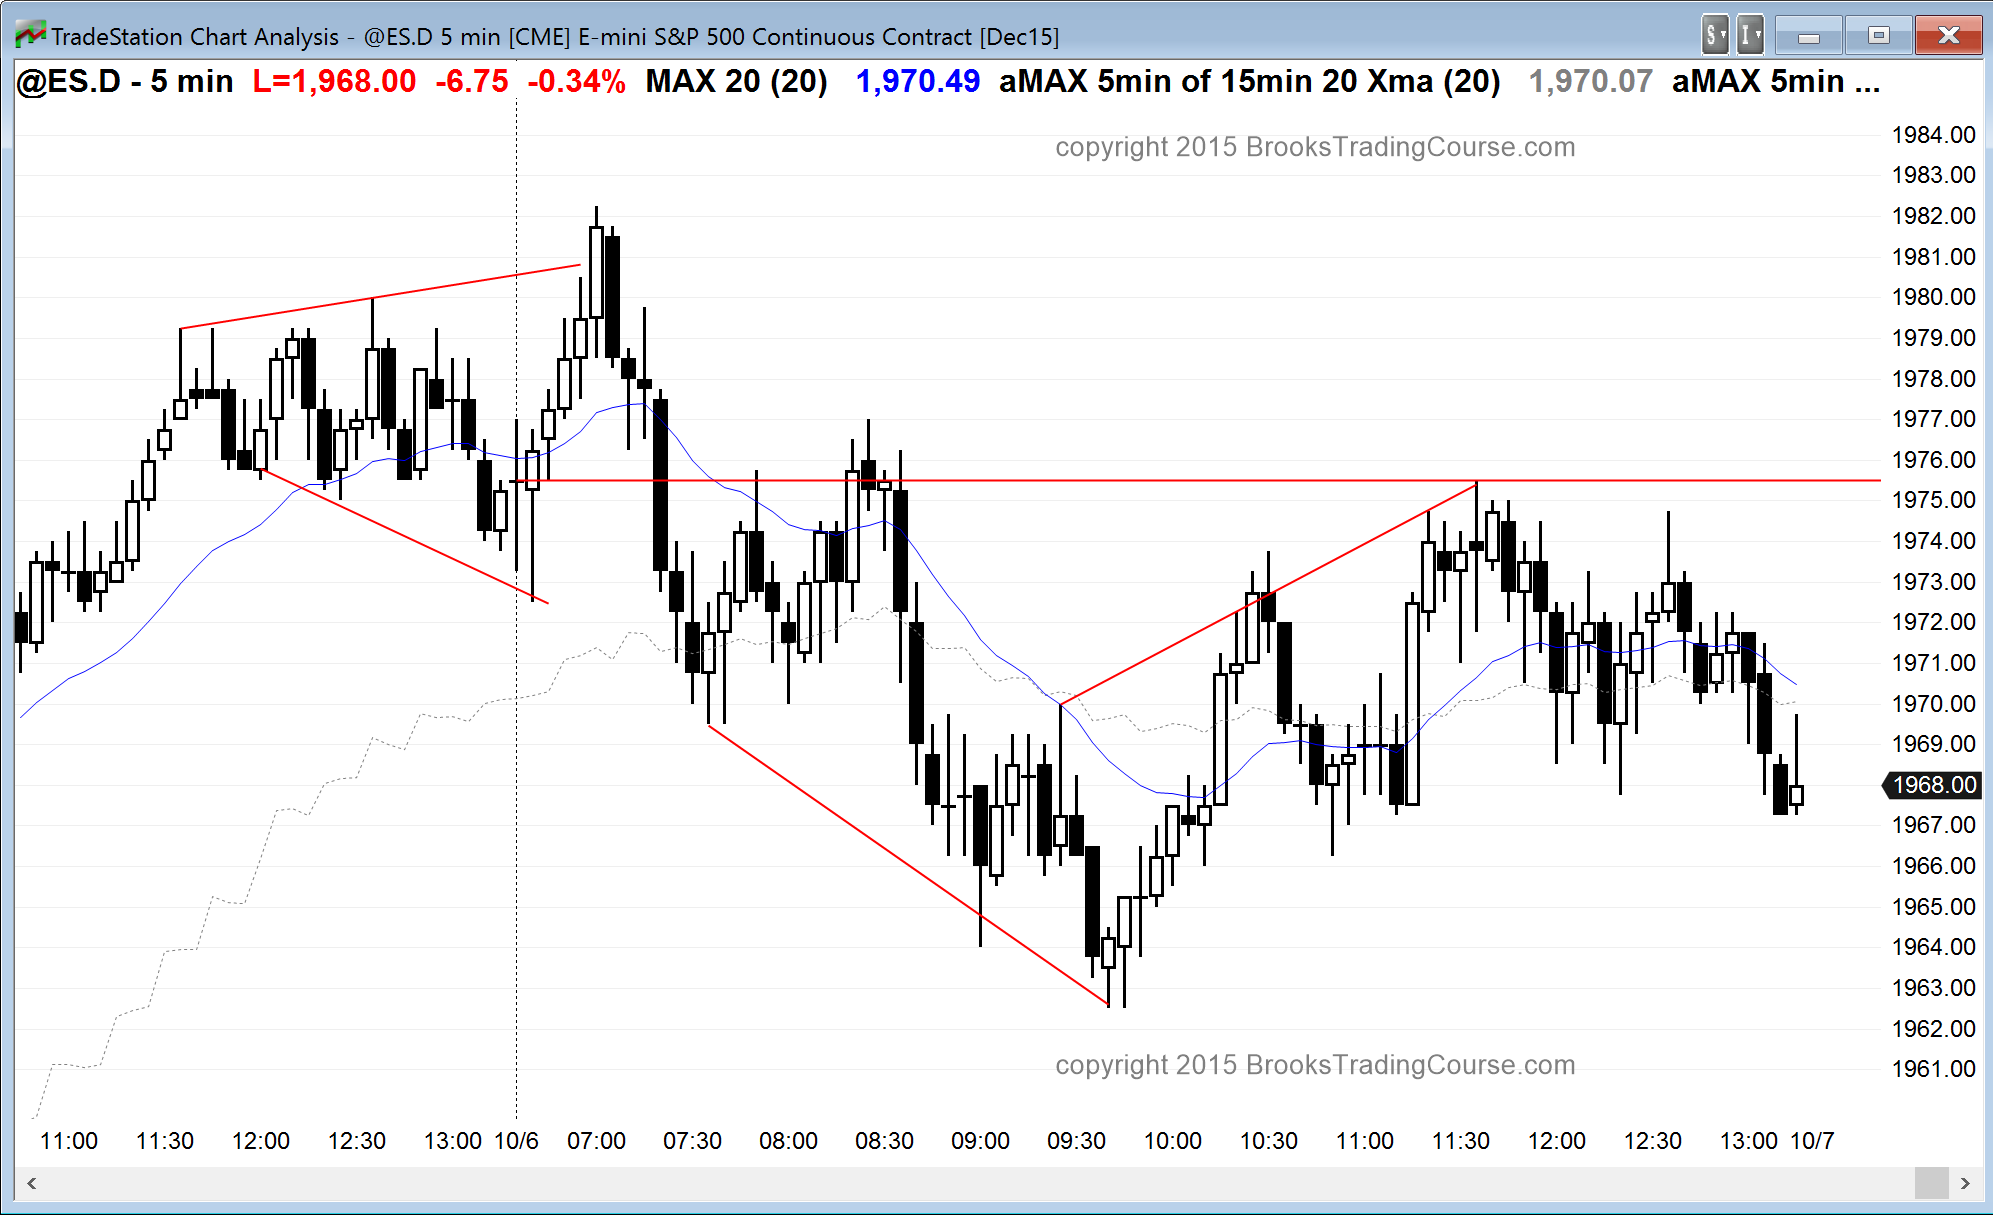
The first bar was a doji and it was in yesterday’s trading range. The first rally reversed sharply. This is trading range price action, which was likely after a 2 day buy climax. The bears want the reversal down from yesterday’s high to be followed by a trend down to yesterday’s low, or at least a measured move down from today’s high to the open, which would be around 1969. The bulls want another strong bull trend day. The odds still favor a trading range day, although there probably will be a swing down at some point that lasts at least a couple of hours as the market becomes less bullish and more two-sided.
While it is possible that today will be a big trend day, it is unlikely. The 2 day rally was strong enough to make a strong bear trend unlikely. The buy climax to resistance makes a bull trend day unlikely. A trading range day with swings lasting 2 – 3 hours is likely. The Emini is currently Always In Long, but it might soon be Always In Short and have swing down for 2 – 3 hours.
Pre-Open Market Analysis
S&P 500 Emini: Learn how to trade the markets testing a gap
Going into the final hour yesterday, the 60 minute chart of the Emini had a 13 bar bull micro channel, which is 13 consecutive bars with the low above the low of the prior bar. It is a sign of strength, but when a market is too strong, traders learning how to trade the markets should realize that two things typically happen. First, the stop for the bulls becomes very far. Computers pay attention to risk. When a stop is too far, the easiest way to reduce risk is to reduce the size of the position. This means that they begin to take profits. They then buy as a pullback reverses back up, and the new stop is below the bottom of the pullback. It is closer that the old stop, and they can again trade at the usual full position size.
The second thing that happens is that the market gets exhausted. When there is a micro channel buy climax like this, the first bear breakout usually is bought and then there is one more new high. Traders who trade the markets for a living saw the dip in the final hour below the low of the prior hour as the first bear break below the micro channel. It was the 1st pullback in 13 bars. Day traders expect that it will be bought and it will be followed by a new high above the top of the bull micro channel. However, that new high usually exhausts the bulls, and then the market has a deeper, more complex pullback. My default is to look for TBTL SD (Ten Bars, Two Legs, Sideways to Down). This would probably result in a test of yesterday’s gap, and it probably will occur this week.
As for the 5 minute chart today, yesterday was the channel of a spike and channel bull trend. The spike began in the final hour of Friday and continued with yesterday’s gap up and initial rally. The Emini was then in a channel for the rest of the day. A bull channel is a bear flag, and there is a 75% chance of a bear breakout. This means that there will probably be a break below the bull trend line today. There might first be a break above, but if there is, there is a 75% chance that it will fail and reverse down below the bottom of the channel. Online day traders know that a bull channel usually ends up as a bull leg in a trading range. This means that a channel usually evolves into a trading range. This is consistent with I just said about the 60 minute chart. Trader should expect more two-sided trading today and tomorrow, and the odds are that the Emini will test the gap at some point over the next few days.
What happens if the dally on the daily chart is instead a resumption of the bull trend instead of simply a bull leg in a month long trading range? Then it will look more like the rally during last October and relentless trade higher without significant pullbacks. There is a 40% chance that this is like last year and a 60% chance that this is a rally in a big bear flag on the daily chart, and it will be followed by at least one more leg down.
Forex: Best trading strategies
The Euro and Yen continued to have small ranges and day traders will continue to look for 10 – 20 pips scalps. If there is a strong breakout up or down, they will try to swing trade for 50 pips. The most interesting Forex cross today is the USDCAD. It has been in a tight bear channel for 4 days on the 6 minute chart, and this is a sell climax. It is also near the bottom of the 2 month trading range. The odds favor a bottom today or tomorrow and then a rally for at least a couple of days. A 50% retracement would be about 150 pips. The rally last night broke above the bear channel. If the rally becomes much stronger, bulls will buy as it goes up. More likely, it will have to test down. When it does, day traders will look to buy the reversal up, expecting a test of last week’s trading range around 1.3250, which is more than 100 pips above the current price. If last night’s rally is followed by a new low, the bulls will buy the reversal up, and they might be able to swing trade for 150 pips.
Although the 4 day selloff can be the start of a bear trend, most trading range breakout attempts fail. This means that this selloff will most likely bounce off the support at the bottom of the 2 month trading range than break strongly below it. Day traders should begin to look to buy either pullbacks or a strong bull breakout.
If the bears win and this 4 day selloff is the start of a bear breakout below the trading range, the odds would then favor a measured move down, which would be about 400+ pips. The odds are against the bears, but if the breakout happens, traders should not be in denial and instead they should sell.
Summary of today’s S&P Emini futures price action and what to expect tomorrow
Because the buying has been climactic for 2 days, the odds favored a trading range day, and possibly another tomorrow. The market is deciding if the reversal up is a resumption of the bull trend on the daily chart, or a bear leg in a month long bear flag. Unless the bulls break strongly above the September high, the probability favors the bears.
Since the rally on the 60 minute chart was so strong yesterday and Friday, a big bear trend is unlikely tomorrow. Because the rally was climactic, a big bull trend is also unlikely as well. The odds favor mostly trading range price action again tomorrow.
Original post was published at Al Brooks Price Action Trading Blog. Check Brooks Trading Course and get The most comprehensive source of information on price action trading available!


 Review")


