The Emini began with a tight trading range after yesterday’s consecutive buy climaxes. There is a 75% chance of at least a couple of hours of trading range price action beginning by the end of the 2nd hour, and it might have already begun. There is a 50% chance of follow-through buying in the 1st hour. There are targets above, like the 60 minute moving average and the bottom of the gap. There are also targets below, like the breakout point above yesterday’s lower high, and the moving average. These are possible limits for a trading range, if one develops.
The Emini had 2 consecutive bear bars and is always in short, but a trading range is more likely than a bear trend. Bears will probably take profits are support and bulls will buy. Both will probably sell the 1st rally. Bulls will sell for a scalp, and bears will sell for a 2nd leg down.
Unless there is a strong breakout up or down, it is more likely that the 2 hours of trading range price action has begun.
Pre-Open Market Analysis
S&P 500 Emini: Day trading tip is to expect more bullish price action
I wrote last week that as strong as the selling was, the bear breakout would fail. I have written the same thing during every strong rally and selloff for the past 3 months, and mostly for all of 2015. That is because of my 80% rule. No matter how strong a leg is within a trading range, 80% of them reverse. Ultimately, one will succeed, but until there is a clear breakout with strong follow-through, there is only about a 20% chance that any attempt will lead to a trend. Obviously the longer a trading range goes on, the closer one gets to the end, but the probabilities still favor reversals. This might chance soon because of a pattern on the daily chart.
The Emini is down about 5 points in the Globex session, but still far above the bottom of yesterday’s strong reversal up from the bottom of the 3 month trading range. There is something unusual on the daily chart. The trading range is sloped down slightly and it has had 3 strong legs down. That means it is a type of wedge bull flag. The 2nd leg barely broke below the 1st, and the 3rd, yesterday, barely broke below the 2nd. This means that yesterday was a failed small breakout of a small breakout. This candlestick pattern is a setup for a successful bear breakout. The ideal pattern is for the current reversal to last 1 – 5 days and then fail somewhere in the middle of the last bear let, maybe at the top of the gap at around 2030. Then, if the Emini falls below yesterday’s low, it would have more than a 50% chance of a swing down. This would be a bear breakout below a special type of bull flag, and it is a reliable pattern. bears will look for a measured move down to around the August low. As I wrote in my weekend blog, there is still about a 30% chance of a move below 1700 and a 20% chance of a test of 1500.
Yesterday had a strong enough bull reversal so that a 2nd leg up is likely. The 2nd leg might not get above the 1st, but it probably will and it will probably lead to some kind of measured move up, like a leg 1 – leg 2 measured move over the next few days. The odds are that any deep pullback today will be bought. There is about a 20% chance that today will totally reverse yesterday’s rally and an 80% chance that today will be either a trading range day or a bull trend day. Since the Emini has been in a trading range for 3 months, a trading range day is more likely, but there will probably be at least one strong bull swing. The bulls were so strong yesterday that the odds are that they will make another attempt at some point today.
Forex: Best trading strategies
I have been predicting the current candlestick pattern on chart of the EURUSD for the past month, and describing it as it unfolded. Last night, it broke below the neckline of the head and shoulders top on the daily and 60 minute and 240 minute charts. The bears need follow-through selling today. This means that today is important. If the bears are able to create a strong bear trend day today, the odds will favor a test of the December 3 low. If today’s candlestick pattern is not a bear bar closing on its low or with at least a bear close, the odds are that however deep this selloff goes, as long as it holds above the December 3 low, it will be followed by a 2nd leg up.
The 60 minute chart has sold off for the past 7 hours. The 7 hours down is unusual and therefore climactic, especially within a trading range. The odds are that today will soon enter a trading range. The NYSE opens in 30 minutes. The selloff over the past week has had a series of sell climaxes. This increases the chance that it will enter a trading range soon. Last night’s selling was strong enough so that the 1st leg up will probably be a minor reversal. A minor reversal means that it might go up for 5 – 10 bars (hours) and then test down. The bears will sell the rally. The bulls will be buying the rally for a scalp, expecting the test down. After the test down to today’s low, which probably will not happen until tomorrow, the bulls will be more willing to hold for a swing up, depending on how weak the leg down is and how strong the reversal up from the double bottom is.
Summary of today’s S&P Emini futures price action and what to expect tomorrow
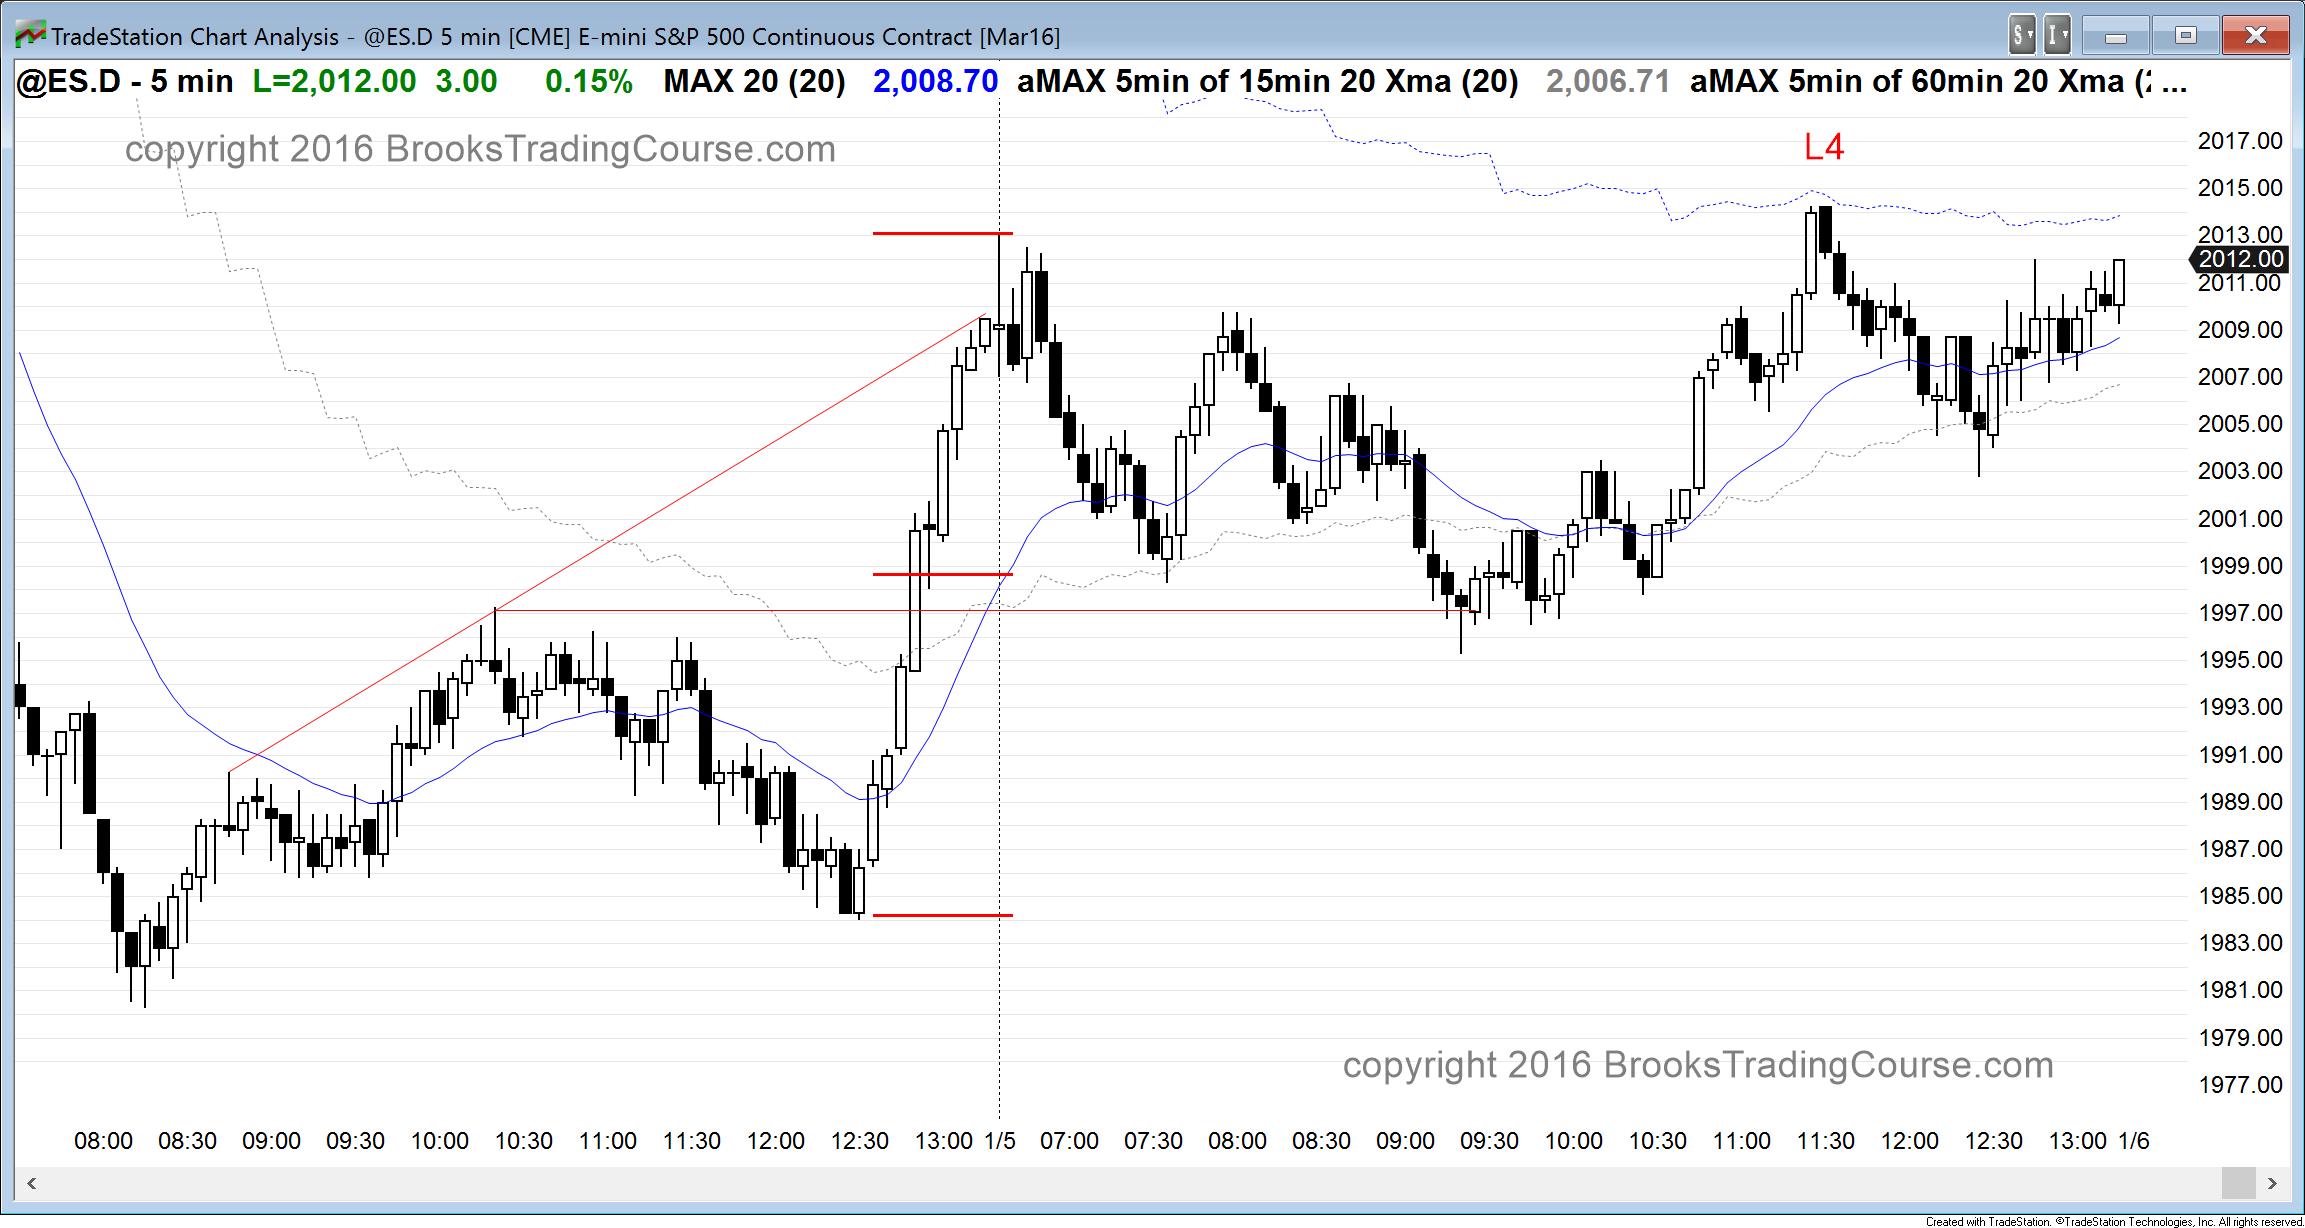
As I mentioned before the open, today had a 75% chance of at least a 2 hour trading range. There was some bull trend resumption at the end of the day, but the Emini stalled at the 60 minute moving average. Tomorrow might gap above the average and create another island bottom on the daily chart. However, if this rally stalls around the midpoint of the last bear leg, bears will sell, looking for a breakout below yesterday’s low. Yesterday created a small breakout below a small small breakout on the daily chart.
This is a type of wedge bull flag. If the Emini rallies for a few days and then falls below yesterday’s low, it would have at least a 50% chance of a relatively quick measured move down, which would be around the August low.
Right now, the momentum is up and it will try to get to the 2030 area, which is the top of the gap down, and it is around a 50% pullback from last week’s selloff and it is near the daily moving average. The bulls need to get above last week’s lower high. Despite yesterday’s reversal up, the next 2 weeks could be very good for the bears. If there is a selloff, it could be fast.
See the weekly update for a discussion of the price action on the weekly candlestick chart and for what to expect going into next week.


 Review")


