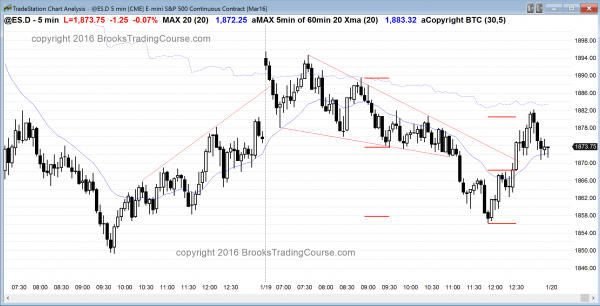
The Emini gapped up but sold off on the open for the 1st several bars. Although the bulls want an opening reversal up from the moving average and then a bull trend day, the size of the selloff makes that unlikely. This means that either a trading range or bear trend day is more likely. Traders will sell the first rally. If the rally is strong, the odds of a trading range day go up. If the rally is brief and the selloff resumes, the bears will probably get a spike and channel bear trend day.
The wedge bottom on the 60 minute chart will probably be followed by a trading range. Even if today is a bear trend day, it will probably spend a lot of time within trading ranges.
Pre-Open Market Analysis
S&P 500 Emini: Day trading tip is to look for a rally this week
The Emini made 3 forceful attempts to successfully break below the September low and failed. This is a wedge bottom. The September low is a higher low compared to the August bear low. Last week formed a double bottom higher low major tend reversal on the daily chart and Friday was a reasonable buy signal bar. The selloff was climactic and ended at support. The odds are that the Emini will bounce for a week or so. Less likely, the wedge bottom will fail without a bounce and then quickly fall for a measured move down based on the 250 point height of the 3 month trading range.
The initial target is the top of the wedge, which is easier to see on the 60 minute chart. That is around 1959. The next target is the bottom of the 3 month range at around 1980. This is around the September 17 lower high. The bears want the rally to fail in that area to create s symmetrical looking head and shoulders top bear flag. The bulls want the rally to continue to a new all-time high. It is too early to know what will happen beyond the next week, but the odds are that the Emini will rally in some kind of a channel. A channel means that it will have deep pullbacks, which means it will probably have one or more big bear days as it works up to the targets.
The Emini is up 23 points in the Globex market and it will probably gap above Friday’s high. The odds are that it will go up for a week or so, so day traders will initially look to buy setups. Since this is probably a bear rally and it will probably have a lot of 2 sided trading, traders will take swing trades in both directions.
Forex: Best trading strategies
The EURUSD is in the middle of a month long tight trading range. The probability over the past month favored the bulls getting a 2nd leg up after the December 3 strong bull trend reversal. However, once a trading range grows to 20 or more bars, the probability drifts back to 50-50, which is where it is today. The past 8 days have formed a tight triangle in the month long trading range. A triangle has a 50% chance of a successful breakout, and a 50% chance of a reversal after the breakout. This is breakout mode trading. With the odds favoring a rally over the next week in the stock market, the odds of at least a test down in the EURUSD are better than 50%.
The range over the past 7 hours has been less than 30 pips. Most traders should wait for it to expand. The alternative is to scalp for 10 pips using limit orders. Since the 1st breakout has a 50% chance of reversing, day traders will have to make quick decisions. If the breakout has many big trend bars, the odds are that it will have at least a 2nd leg up. If it stalls within a couple bars, traders will be ready for a reversal trade.
Summary of today’s S&P Emini futures price action and what to expect tomorrow

The Emini will probably trade up to the 1930 – 1950 area over the next week or two because it is oversold and finding support at the September low. Traders will look to buy strong selloffs, like today. The moves up and down are big enough for swing trades in both directions.
See the weekly update for a discussion of the price action on the weekly candlestick chart and for what to expect going into next week.
See the weekly update for a discussion of the price action on the weekly candlestick chart and for what to expect going into next week.


