Monthly S&P500 Emini futures candlestick chart:
Bull breakout is losing momentum

The monthly S&P500 Emini futures candlestick chart is in a bull trend. When a gap forms late in a bull trend, it usually closes before the rally gets too far. Since the odds are that those targets above are too far, the Emini will probably test down about 100 points in the next couple of months. While there is no credible top yet, traders will be quick to sell.
The 2 year trading range below is a magnet (hence, a potential Final Bull Flag). A reversal down will probably get there within a few bars (months). Because this 3 month breakout is strong and there are several targets above, the odds are that the reversal will create a bull flag. Hence, a bear trend probably will need at least a micro double top. That would take at least 2 – 3 more months to form. Therefore the downside risk over the next couple of months is about 5%, which would be a test of the August high.
Weekly S&P500 Emini futures candlestick chart:
Weak bull channel
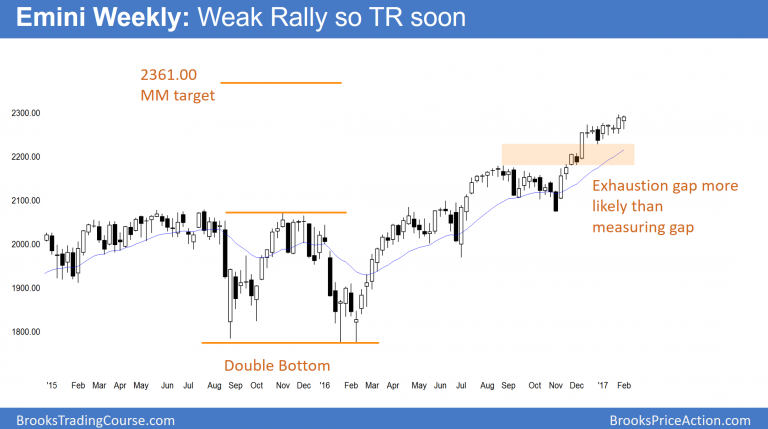
The weekly S&P500 Emini futures candlestick chart had a big bull breakout in December. It therefore made follow-through buying likely. Since the follow-through has been basically a tight trading range that is sloped up slightly, the buying is weak. Yet, there is no credible top. Furthermore, this week formed an ioi, and it had a bull body. While an ioi late in a trend is a breakout mode pattern, the probability for the bears is less because of this week’s bull close. Therefore, if the Emini triggers the sell next week by falling below this week’s low, the reversal will probably be minor. The bears need to do more before traders believe that they have taken control.
The ioi is also a small bull flag. Since the past 8 weeks have been mostly in a tight range, the odds of a strong bull breakout are small. Yet, the odds still favor at least a little more up until the bears either create s credible top or a big bear trend bar.
Daily S&P500 Emini futures candlestick chart:
Emini island top and island bottom bull flag
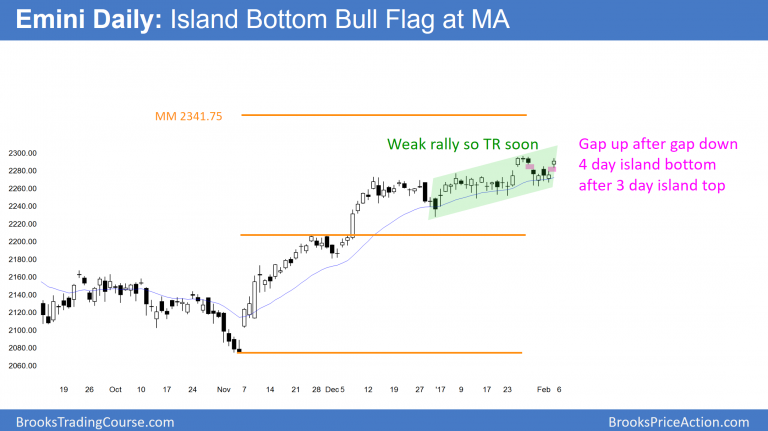
The daily S&P500 Emini futures candlestick chart has both an island top and an island bottom. Hence it is in breakout mode. Because the bulls keep buying pullbacks to the moving average, the odds favor a bull breakout.
Yet, as long as it does not rally above the island top, some bears will continue to bet that the 5% correction has begun. Hence, the bulls need a new high. However, the Emini has been in a tight trading range for 2 months. Therefore, bears will probably sell the new high, betting on a failed breakout. In addition, bulls will probably exit with a small profit.
This is because they correctly believe that the Emini will have a difficult time escaping the gravitational pull of the 2 month range. For 2 months, bulls and bears agreed that the Emini belonged around 2280. If it rallies above 2280, many bulls will take a quick profit and bears will scale into short. Therefore, the odds are that the bull breakout would fail within a few weeks.
Exhaustion gap is more likely than measuring gap
The Emini never tested the breakout point at the August trading range high. Since the Emini is late in a bull trend, the odds are that the gap between the low of 6 weeks ago and the August high is an exhaustion gap, not a measuring gap. Therefore, it is more likely that the Emini will fall about 100 points to close the gap than rally for a measured move up.
Risk of cascading stop running
The current tight trading range is similar to the one in July and August. There is therefore a risk of a huge bear trend day within the next several weeks. The Emini is at the top of a bull trend. In addition, it is in a tight channel with many small higher lows. Therefore, a small selloff that goes below the closest higher low will make some bulls give up. As the Emini falls below other higher lows, more bulls give up. As a result, most of the buyers over the past 2 months will quickly be holding losing positions. If enough bulls suddenly decide that the Emini will test the August high, a sudden exit could create a big bear trend bar. September 9 is an example of a similar situation.
Traders can see the end of the day bar-by-bar price action report by signing up for free at BrooksPriceAction.com. I talk about the detailed Emini price action real-time throughout the day in the BrooksPriceAction.com trading room. We offer a 2 day free trial.
When I mention time, it is USA Pacific Standard Time (the Emini day session opens at 6:30 am PST, and closes at 1:15 pm PST). You can read background information on the intraday market reports on the Intraday Market Update page.


 Review")


