Monthly S&P500 Emini futures candlestick chart: Weak sell signal
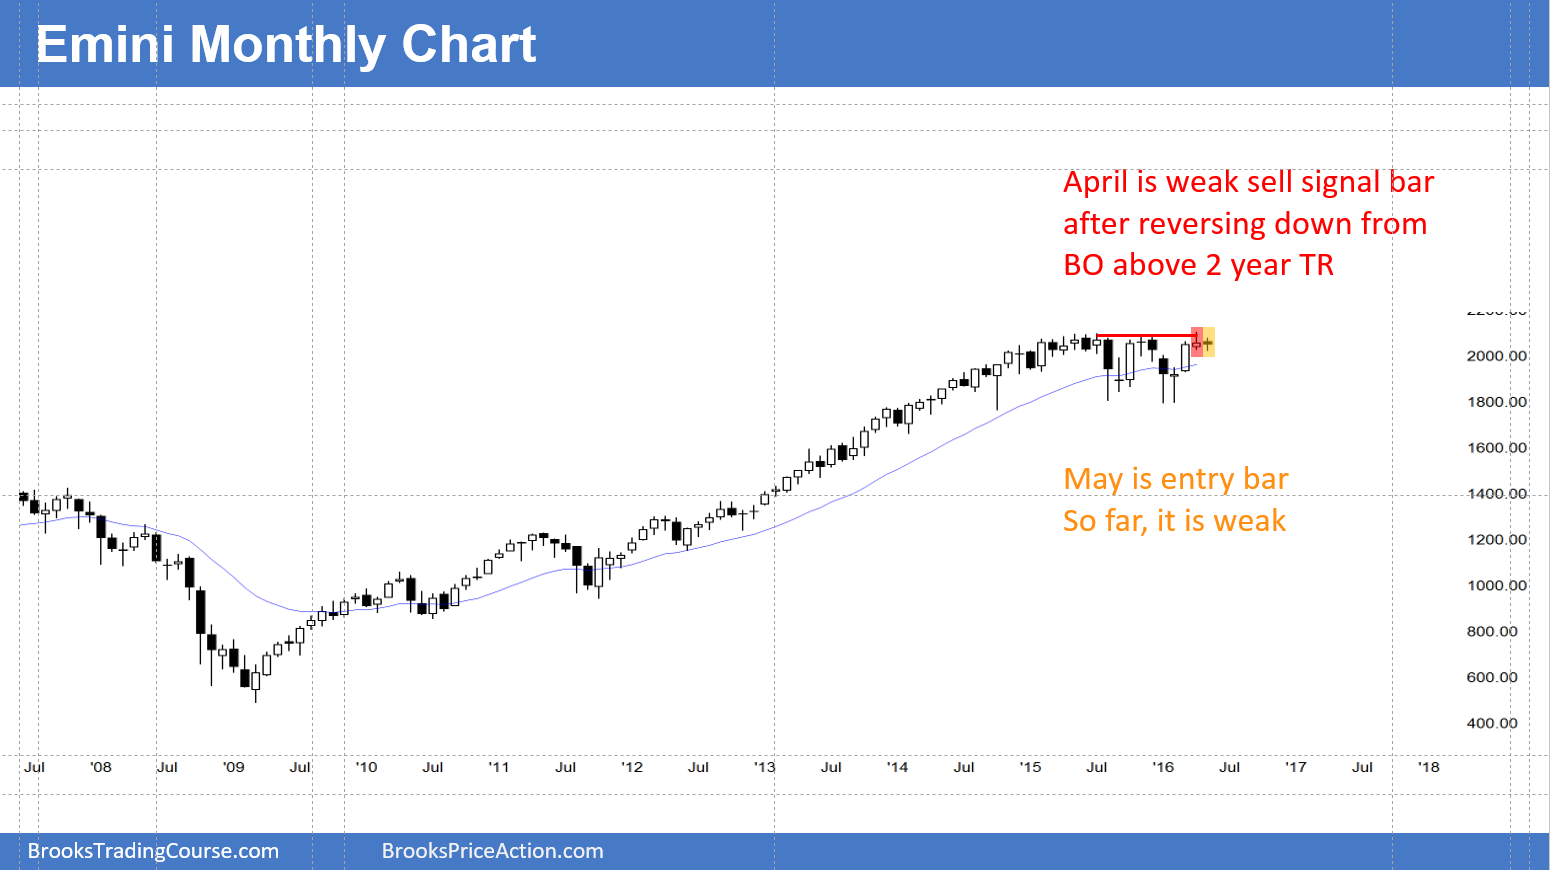
Regarding the monthly S&P500 Emini futures candlestick chart, I have been saying since the end of April that May would probably trade below the April low, and it did this week. April broke above the top of a 2 year trading range to a new all-time high. Most trading range breakouts fail. April closed below its midpoint and it was therefore a sell signal bar for the failed breakout on the monthly chart. Because February and March were strongly bullish and April had a bull body, the odds were that there would be more buyers than sellers below the April low, even though April was a sell signal bar.
There is still a week left to the month. That is enough time for a big move up or down. May could again fall below the April low and even get down to the bottom of the March bull trend bar, totally reversing that bull breakout. That is unlikely.
April was a small bar. May traded below the April low. May could continue up and trade above the April high. May would then be an outside up month, and that would be a sign of bull strength. What is most likely is that the Emini will continue to do what it has been doing for 2 months, and that is stay sideways. If so, May would end up being a small bar, just like April, and have no predictive value. Bulls would see it as a buy signal bar for the pullback from the April breakout to a new all-time high. Bears would see it as a micro double top with the April high. The micro double top would make them then conclude that the probability of a selloff was then a little higher if June fell below the May low.
Weekly S&P500 Emini futures candlestick chart: Bull flag
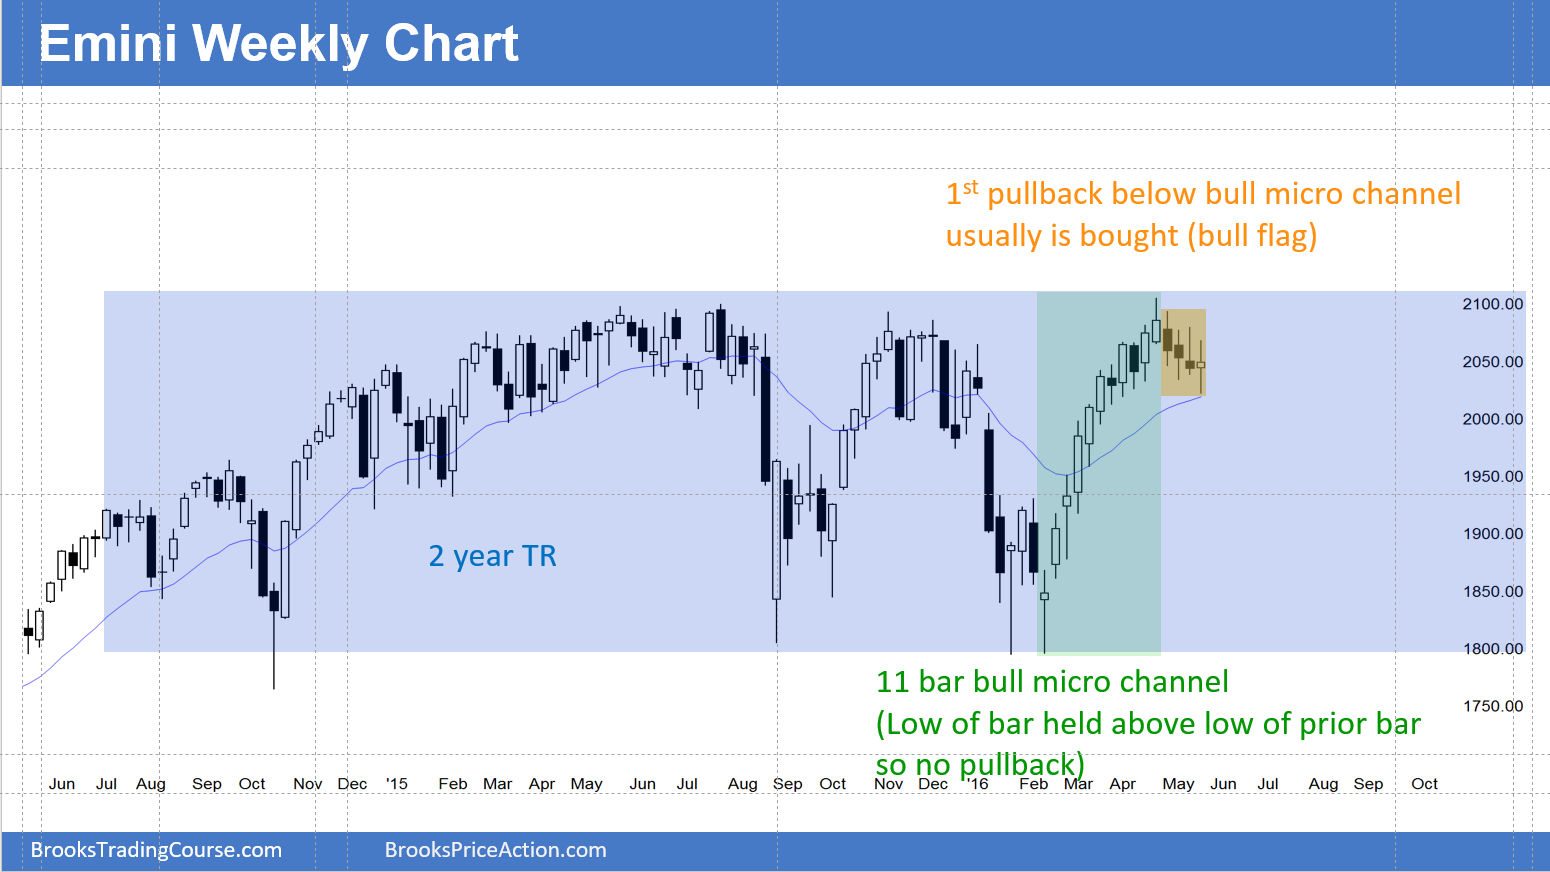
The weekly S&P500 Emini futures candlestick chart has been sideways for 4 weeks after breaking below an 11-week bull micro channel. No pullback to below the low of the prior bar for 11 weeks is a sign of strong bulls, but it is also unsustainable and therefore climactic. Once there is a pullback, it usually last 1 – 3 bars, and then the Emini resumes up to test the top of the micro channel.
The current pullback has lasted 4 weeks, which is getting long. This increases the chance of a bounce within the next 2 weeks, especially since the weekly chart is testing its 20 week EMA. Yesterday was a Friday and the week closed above the open of the week. This means that this past week was the 1st bull bar in the past 4 weeks. However, after 3 bear bars, the bulls will probably have to go sideways for a week or two before they can test up. Also, the weekly chart now has 3 dojis, which also increases the chances of at least a little more sideways trading.
The 11-week bull micro channel represents strong bulls. The odds still favor a test up within the next few weeks.
Daily S&P500 Emini futures candlestick chart: Learn how to trade failed candlestick patters
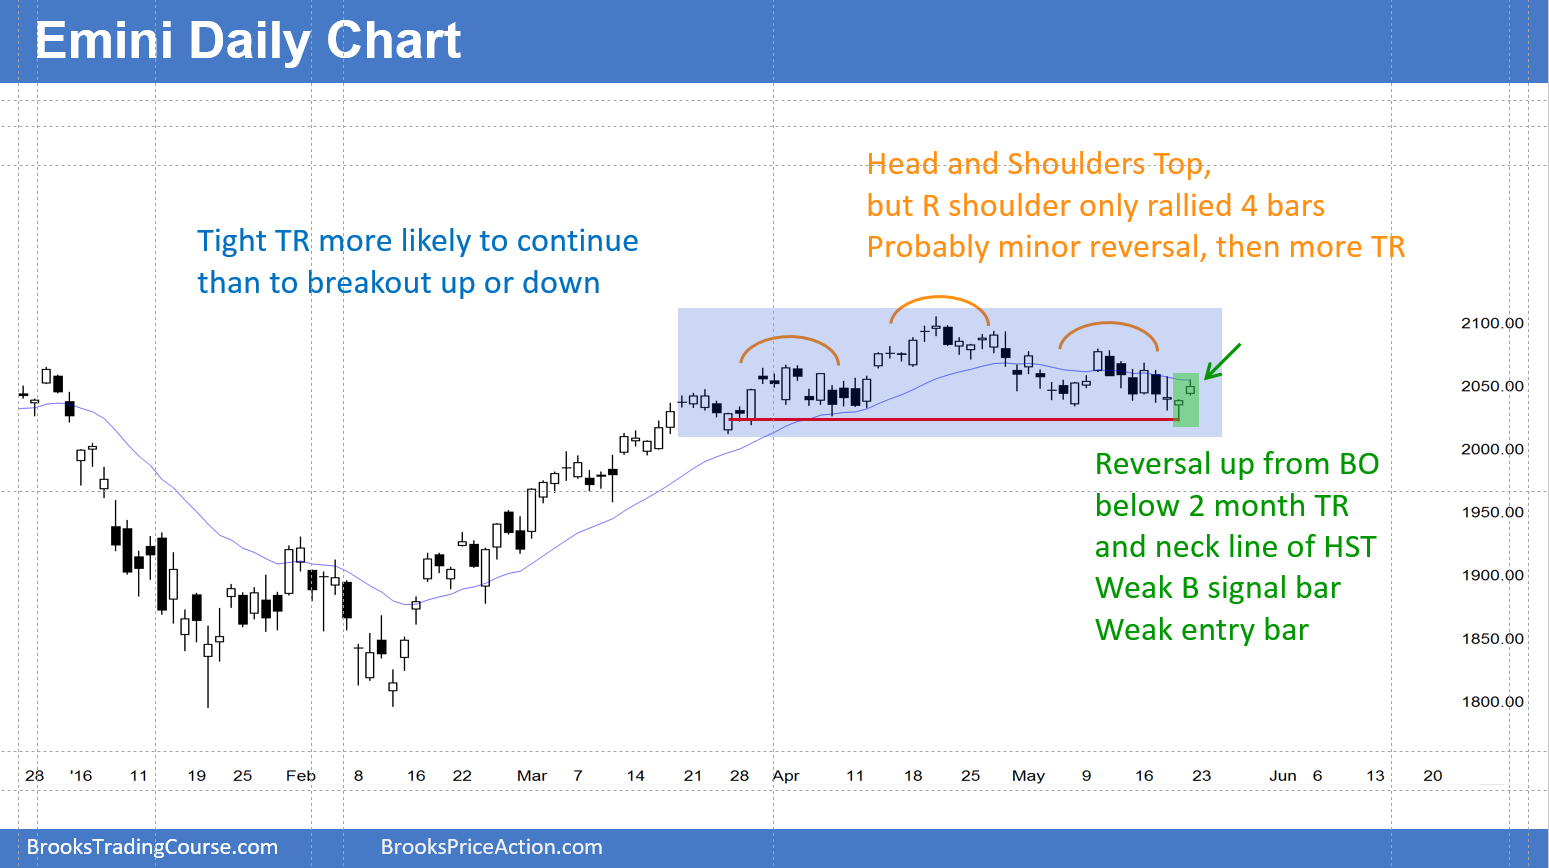
The daily S&P500 Emini futures candlestick chart on Thursday fell below the bottom of its 2-month trading range and reversed up, but stalled at the 20 day EMA on Friday. It is trapped between the daily and weekly moving averages. Most trading range breakouts fail. However, Thursday was a weak buy signal bar because it had a small body. Also, the daily chart has been in a tight trading range for 2 months and that makes a big move up or down unlikely. The best indication of what the bars to the right will look like is the appearance of the bars to the left. The odds are that the trading range will continue.
It might continue up to the June FOMC meeting, which is important because it is probably the final chance for the Feds to raise rates before the election. This means that the Feds might be forced to raise rates earlier than the might want to avoid waiting to raise them longer than they might want. Although everyone says that the rate increase will result in a selloff, you always have to remember that the market probably has already factored in a rate hike. If so, the stock market could actually rally instead of selling off.
Those confident experts on TV do not have a clue. Their sole purpose is to attract eyeballs so that CNBC can collect advertising dollars. No one knows what will happen. Traders will just wait to see the reaction. If the market goes up, I will buy. If it goes down, I will sell. I don’t care about whether the Fred raises rates or not. All I care about is whether I can make money from the market going up or down, and I have to wait to see the reaction after the announcement to find out.
See the weekly update for a discussion of the price action on the weekly candlestick chart and for what to expect going into next week.


 Review")


