Monthly S&P500 Emini futures candlestick chart: Strong reversal up from sell signal
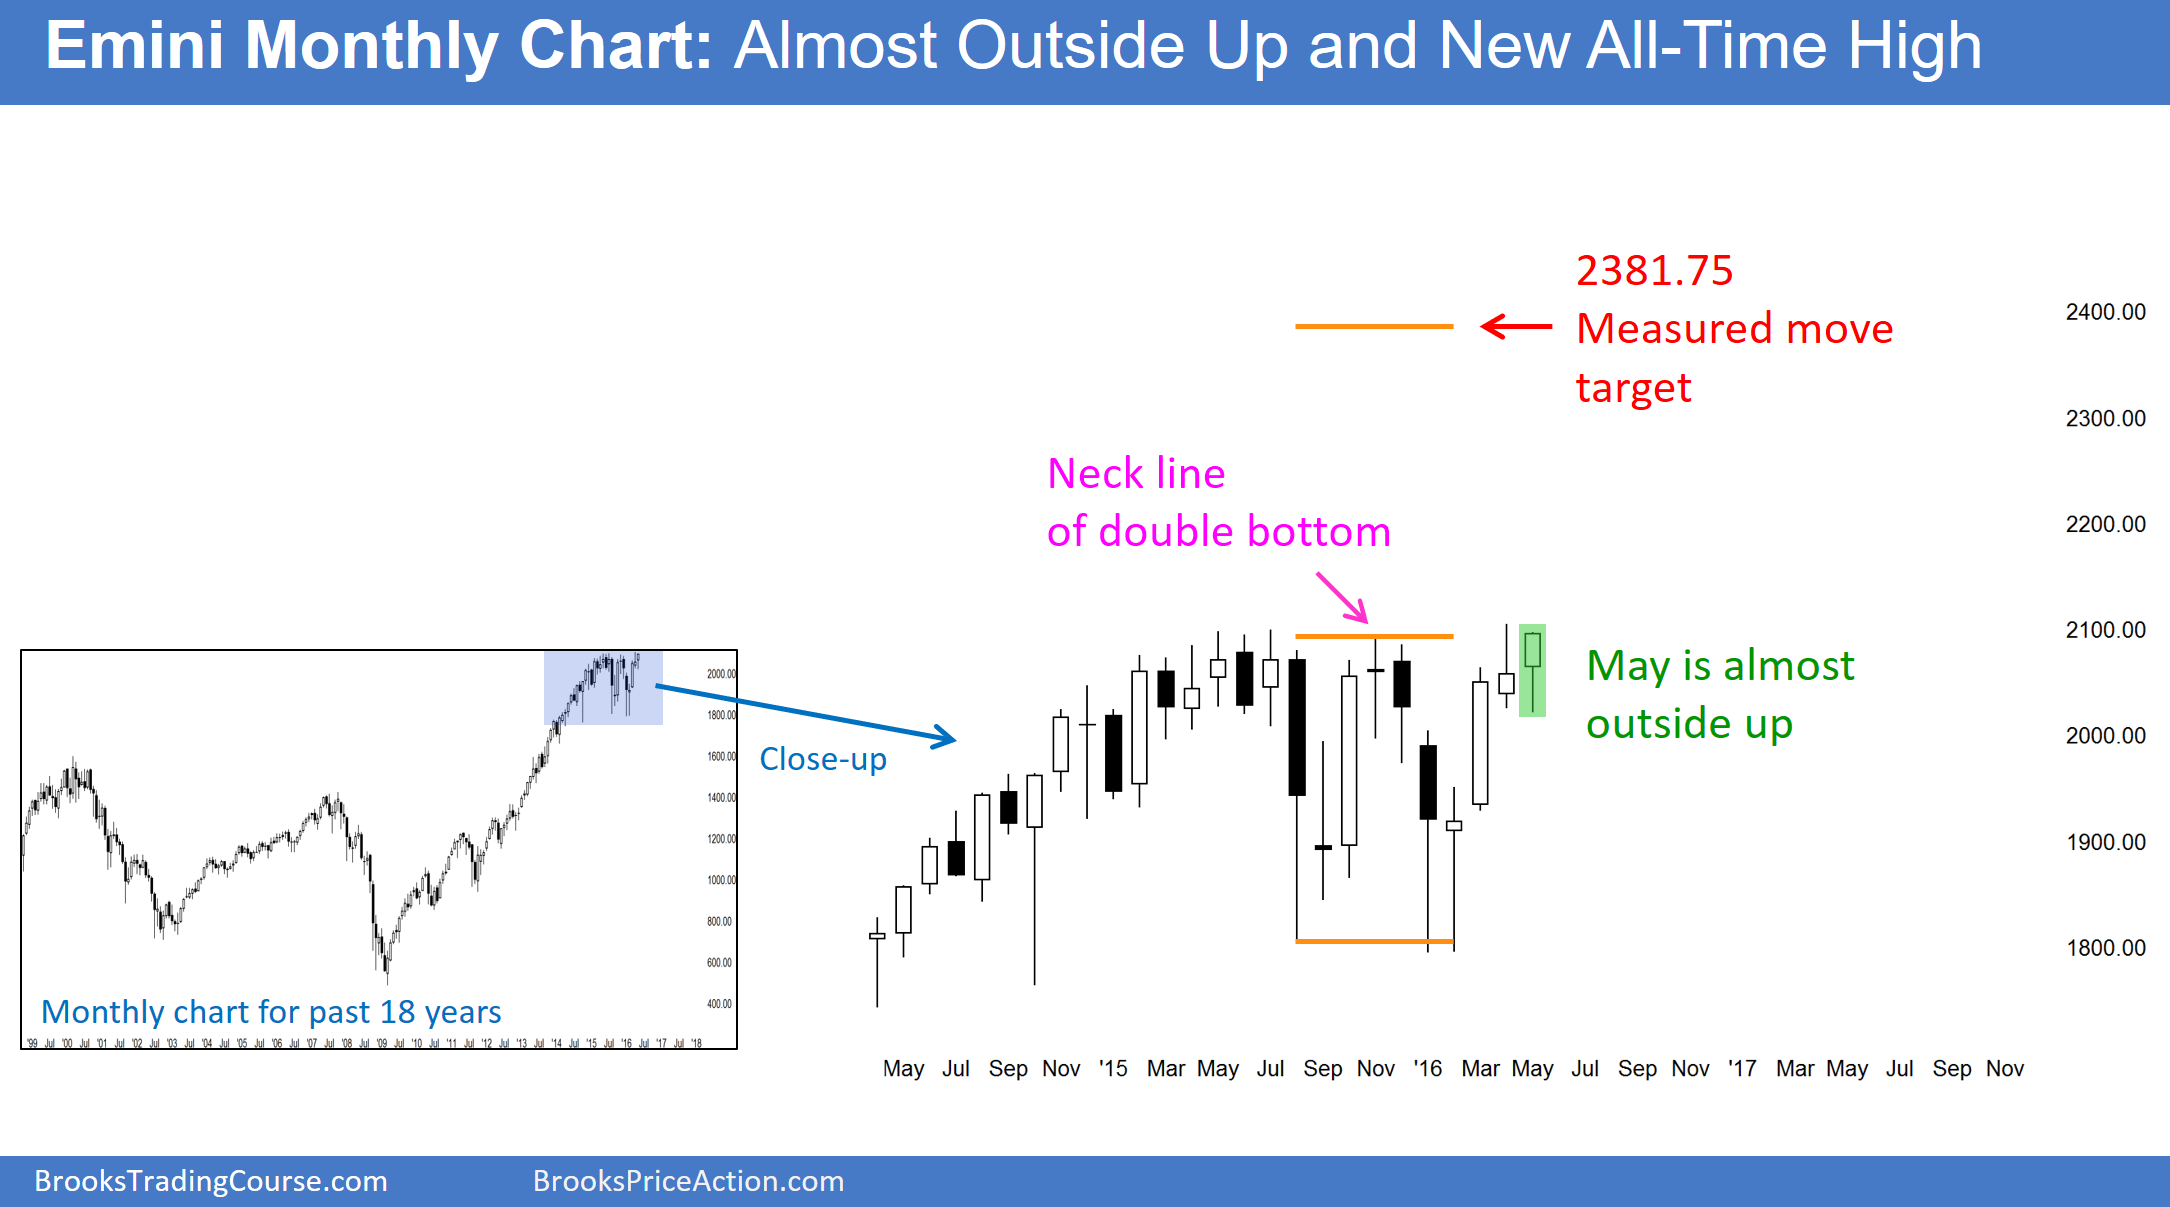
The monthly S&P500 Emini futures candlestick chart triggered a sell signal in early April when May traded 1 tick below April’s low. I have written many times since late April that there would probably be more buyers than sellers below April’s low. The sell signal bar (April) had a bull body, and the reversal up in February and March was very strong. Also, the monthly chart has been in a strong bull trend for 7 years, since the 2009 low.
The correction over the past 2 years has had enough bars so that profit-taking bulls were getting confident that the chances of a 20% selloff and measured move down were getting small. They began to buy and quickly discovered that there were not many bears who were willing to sell. There is only 1 trading day left in May and the April high, which is the all-time high, is only about 8 points above Friday’s close. That is close enough so that the bulls could easily get above it on Tuesday, the final trading day of the month, and even close at an all-time high.
If the bulls do get a breakout to a new high, the odds of follow-through buying are greater if the breakout candlestick is big and closes far above the trading range and prior high. Also, if there is a series of consecutive big bull bars, the odds of a measured move up go up. The 2 year trading range is 300 points tall so the measured move target is around 2,400.
The bears see this 2 year trading range as a potential Double Top, or, if there is a bull breakout, a Final Bull Flag. They expect any bull breakout to fail and reverse back down. They want a relentless reversal that leads to a breakout below the 2 year range. If they get it, their target is a measured move down. That 300 point selloff would take the Emini down to second high of the double top from 2007, which is around 1500.
If May is an outside up month, traders have to be ready for a possibly ioi setup on the Monthly chart. This meas that June might be an inside bar. If so, then the 3 month pattern is a breakout mode setup. If June is a bear inside bar closing on its low, it would be a sell setup. It would the the 2nd sell signal for the failed breakout above the 2 year range (April was the 1st sell signal).
Weekly S&P500 Emini futures candlestick chart: Price action shows bull trend resumption after small bull flag

The weekly S&P500 Emini futures candlestick chart had a 4 week pullback from an 11 bar bull micro channel. Most bear breaks below strong bull micro channels like this usually fail with 3 weeks and become a bull flag. Here, the bull flag lasted 4 weeks and was filled with dojis. This usually results in further sideways trading. Instead, it was followed by a strong bull breakout this week.
When there is a bear breakout below a bear channel and then a trend resumption up, the rally usually fails within about 5 bears. The bull micro channel is a buy climax, and a buy climax is usually followed by a trading range. It is too early to know if that will happen here. At the moment, there is probably about a 50% chance of a trading range withing the next 4 weeks or so, even if there is 1st a strong 5 bar rally. Remember, the Fed might raise interest rates in June or July, and that could result in several weeks of selling.
Can the breakout be big and relentless like the 1995 bull breakout on the monthly chart? That is not likely after an 11 bar bull micro channel, which is a buy climax, but traders will buy as the market goes up until there is evidence that the breakout has ended.
Daily S&P500 Emini futures candlestick chart: Strong bull breakout, testing all-time high
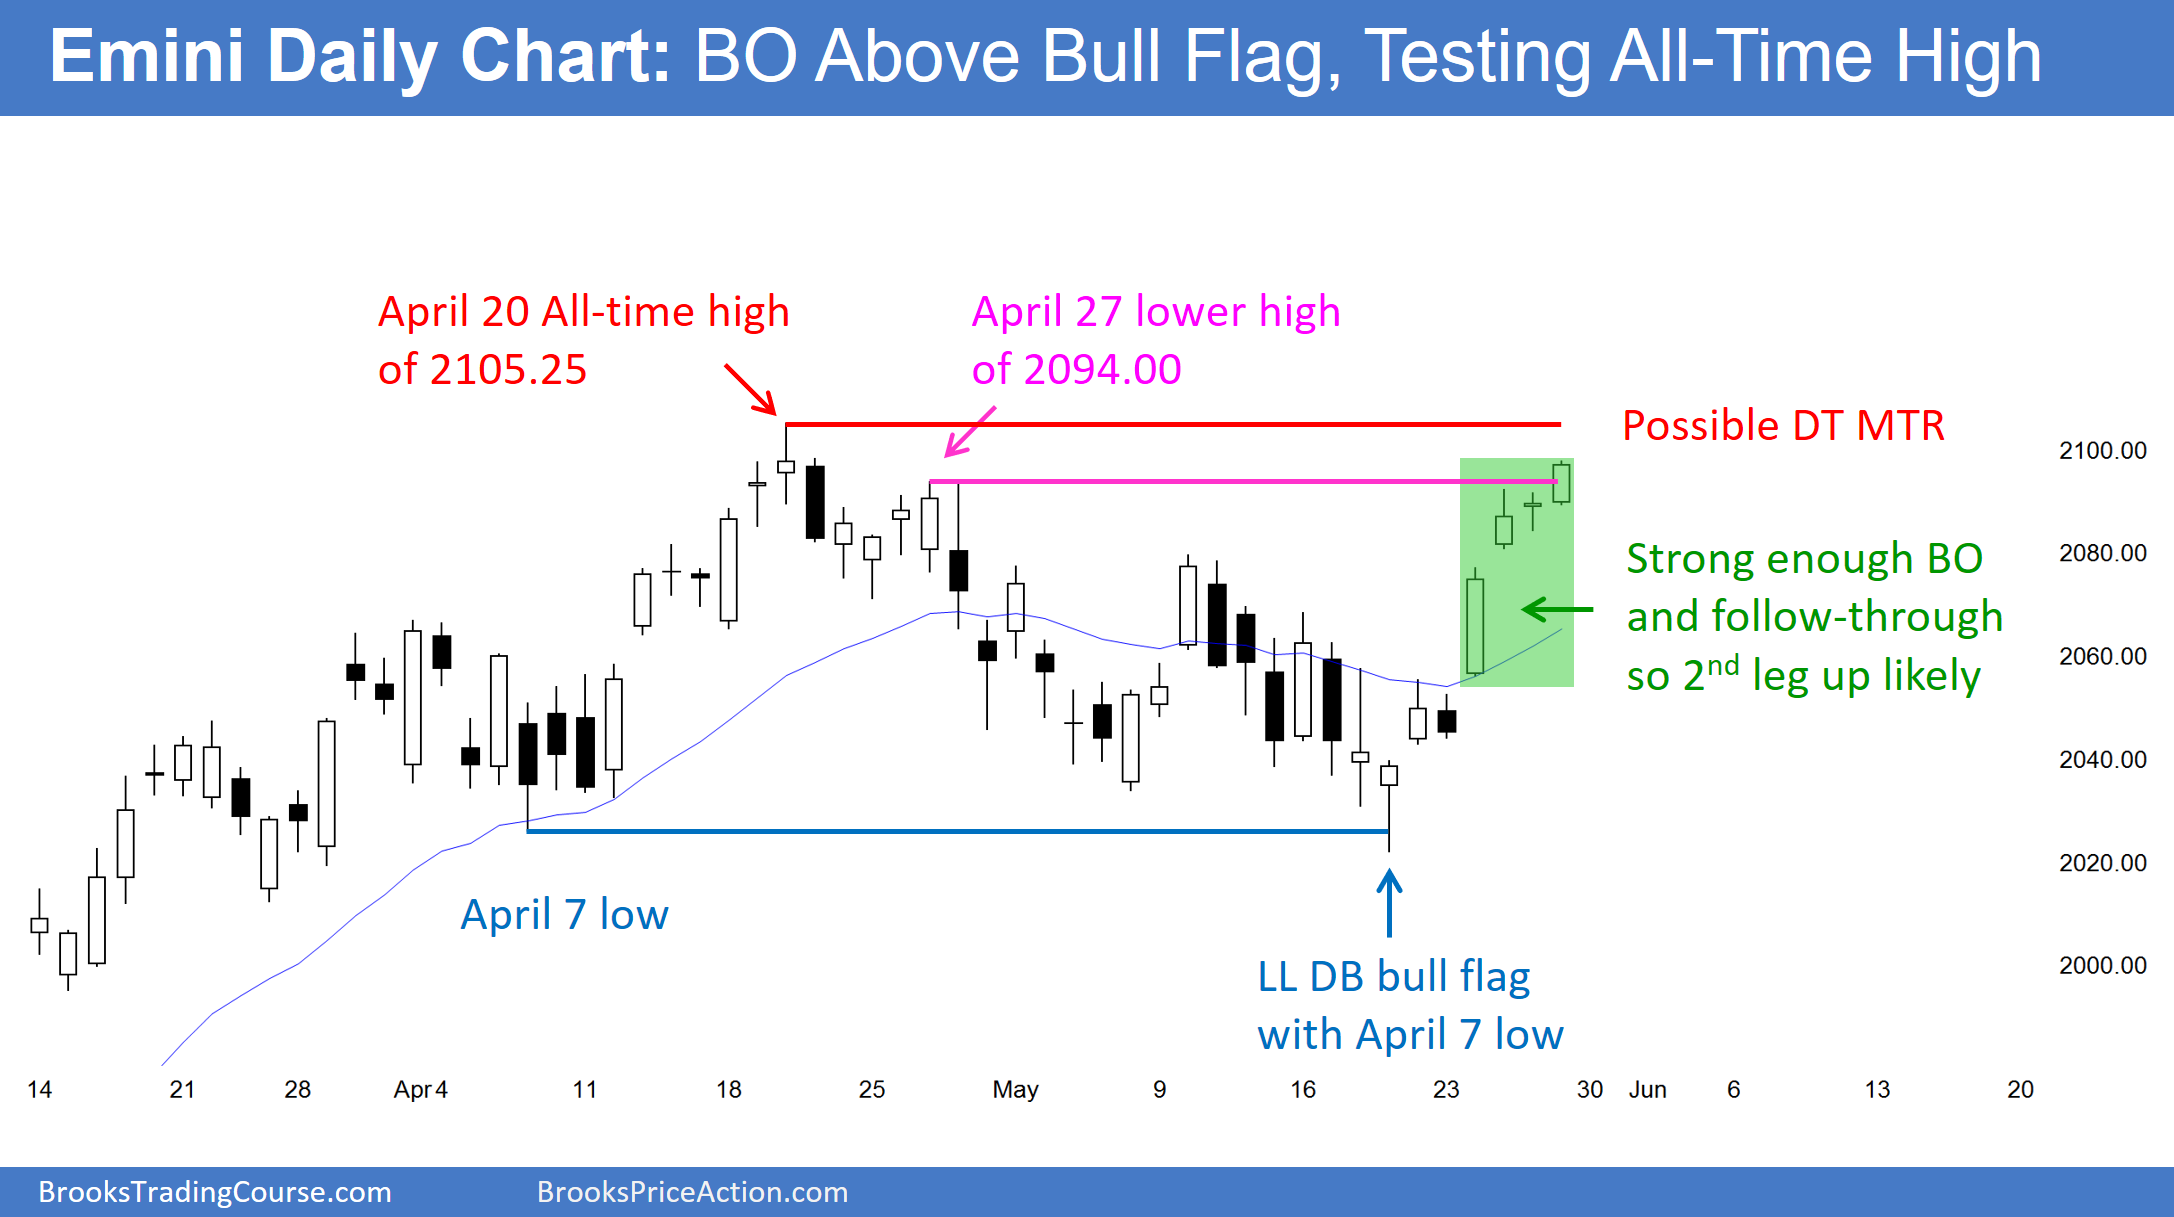
The bulls are trying to get Tuesday, the final day of May, to close above the April high, which is the all-time high. If they succeed, and Tuesday is a big bull trend bar that closes far above April on the daily and monthly charts, and there is strong follow-through buying, the odds of a strong rally from there go up.
The Emini has been in a trading range for 2 years. One of the hallmarks of a trading range is disappointment. This means that the odds are, the bulls will be at least a little disappointed once May closes on Tuesday. For example, Tuesday might break to a new all-time high, but then close below the April high. The bulls want the character of the market to change to that of a strong bull breakout. Markets have inertia. This makes it more likely that they bulls will not get all of the signs of strength that they hope to get, and they will be disappointed.
The daily S&P500 Emini futures candlestick chart was in a bear channel for the past month. It had 2 legs down, and the 2nd leg fell below the bottom of the 2 month trading range. This was followed by a strong reversal up. The 2 legs down created a High 2 bull flag. There is also a lower low double bottom with the April low (the April 7 low).
The rally of the past 4 days has been strong enough to show everyone that the bulls are very eager to buy. When they are buying at the high of every day, they are usually very eager to get a chance to buy below the low of the prior bar. This means that the odds are that the 1st pullback will be bought. The bears will probably need at least a micro double top if they are going to get a swing down. Strong rallies are usually not followed by strong selloffs. The market usually has to go sideways for at least a few bars first.
The bears are hoping for a major trend reversal with the April 20 all-time high. They know that they are taking a low probability trade by selling here, but the risk is small. They will exit 10 – 20 points above the all-time high. The reward is very big. They want a bear breakout below the 2 year range and a measured move down to around 1800. This strong risk/reward more than offsets the low probability of success.
Whenever a market tests any major resistance, traders watch the price action carefully. Will the rally suddenly stall and evolve into a tight trading range? If so, bulls will begin to take profits and bears will sell. The bears want a swing down from the top of the 2 year trading range. This could result in a double top with the April 7 all-time high (a double top major trend reversal). However, the odds of that leading to a swing down are only 40%. There is a 60% chance that the reversal down will be bought.
The bulls want a strong bull breakout and a measured move up. The breakout usually happens in one of two ways. First, there can be 1 – 5 big bull trend bars closing near their highs. This is a strong bull breakout. The further the breakout bar closes above prior resistance (like the old all-time high) and the smaller the tail on top of the bull breakout, and the more consecutive bull trend bars that follow, the more likely the rally will be followed by a measured move up.
The 2nd common type of successful bull breakout begins slowly with a series of 2 – 5 small bull trend bars closing near their highs. Once a critical mass of small bull trend bars is reached, bulls and bears suddenly decide that the bulls are winning and therefore higher prices are likely. The bulls sell out of their longs, and bears buy aggressively, betting on a measured move up after the breakout. This the results in a delayed breakout bar, but the odds of a measured move up are then still good.
Whenever something looks especially obvious (high probability), traders have to be ready for a Pain Trade, which is the exact opposite of what the market apparently so clearly wants to do. If there is a strong reversal down, those who trade the markets for a living will not be in denial. They will sell. Bulls should get out quickly because the selloff could be fast and last a lot of bars. If the bulls hold, denying what is in front of them, they can lose a lot of money.


 Review")


