The Emini sold off from above yesterday’s high, but the follow-through bars were bad for the bears. This increases the chances that the selloff will be a bear leg in a trading range. The bulls tried to reverse up from the 60 minute moving average, but the 3 big bear bars make a trading range more likely than a strong rally. The Emini is Always In Short, but the big up at then end of yesterday and the big down today created confusion. This makes an early trading range likely.
The bad follow-through after big bear bars happens more often in a trading range than a bear trend. This is a trading range open, and it increases the chances that the 1st selloff and the 1st rally will be limited and followed by a trading range for the 1st 1 – 2 hours. If instead there is a strong breakout up or down, traders will switch to swing trading. Otherwise, they will scalp and wait to see if a trading range forms. If one does, they will look to sell below a bear sell signal bar in a double top or wedge top, and look to sell above a bull signal bar in a double bottom or wedge bottom.
Pre-Open Market Analysis
S&P 500 Emini: Learn how to day trade a trend reversal
Yesterday was a bad follow-through day for the bears after their 2 strong days last week. This is consistent with the Emini being in a 2 month trading range, and it is evidence that a bear trend has not yet begun on the daily chart. The Emini is holding around the support of the September high and has not yet broken below the range. The bulls reasonably see the 3 pushes down over the past 6 weeks as simply tests of support, and part of the process of creating a bull flag.
The bears need a strong breakout below the bull flag with follow-through selling before traders will conclude that the trading range has ended and a bear trend has begun on the daily chart. Until there is a clear breakout up or down, the bulls and bears continue to both have a 50% chance of success.
This is Christmas week, and the trading often becomes very quiet in the days before Christmas until after New Year’s Day. However, yesterday had several good swings. Although day traders are prepared for tight trading ranges and scalping for 1 point with limit orders, they will continue to swing trade for 4 or more points while the Emini continues to move.
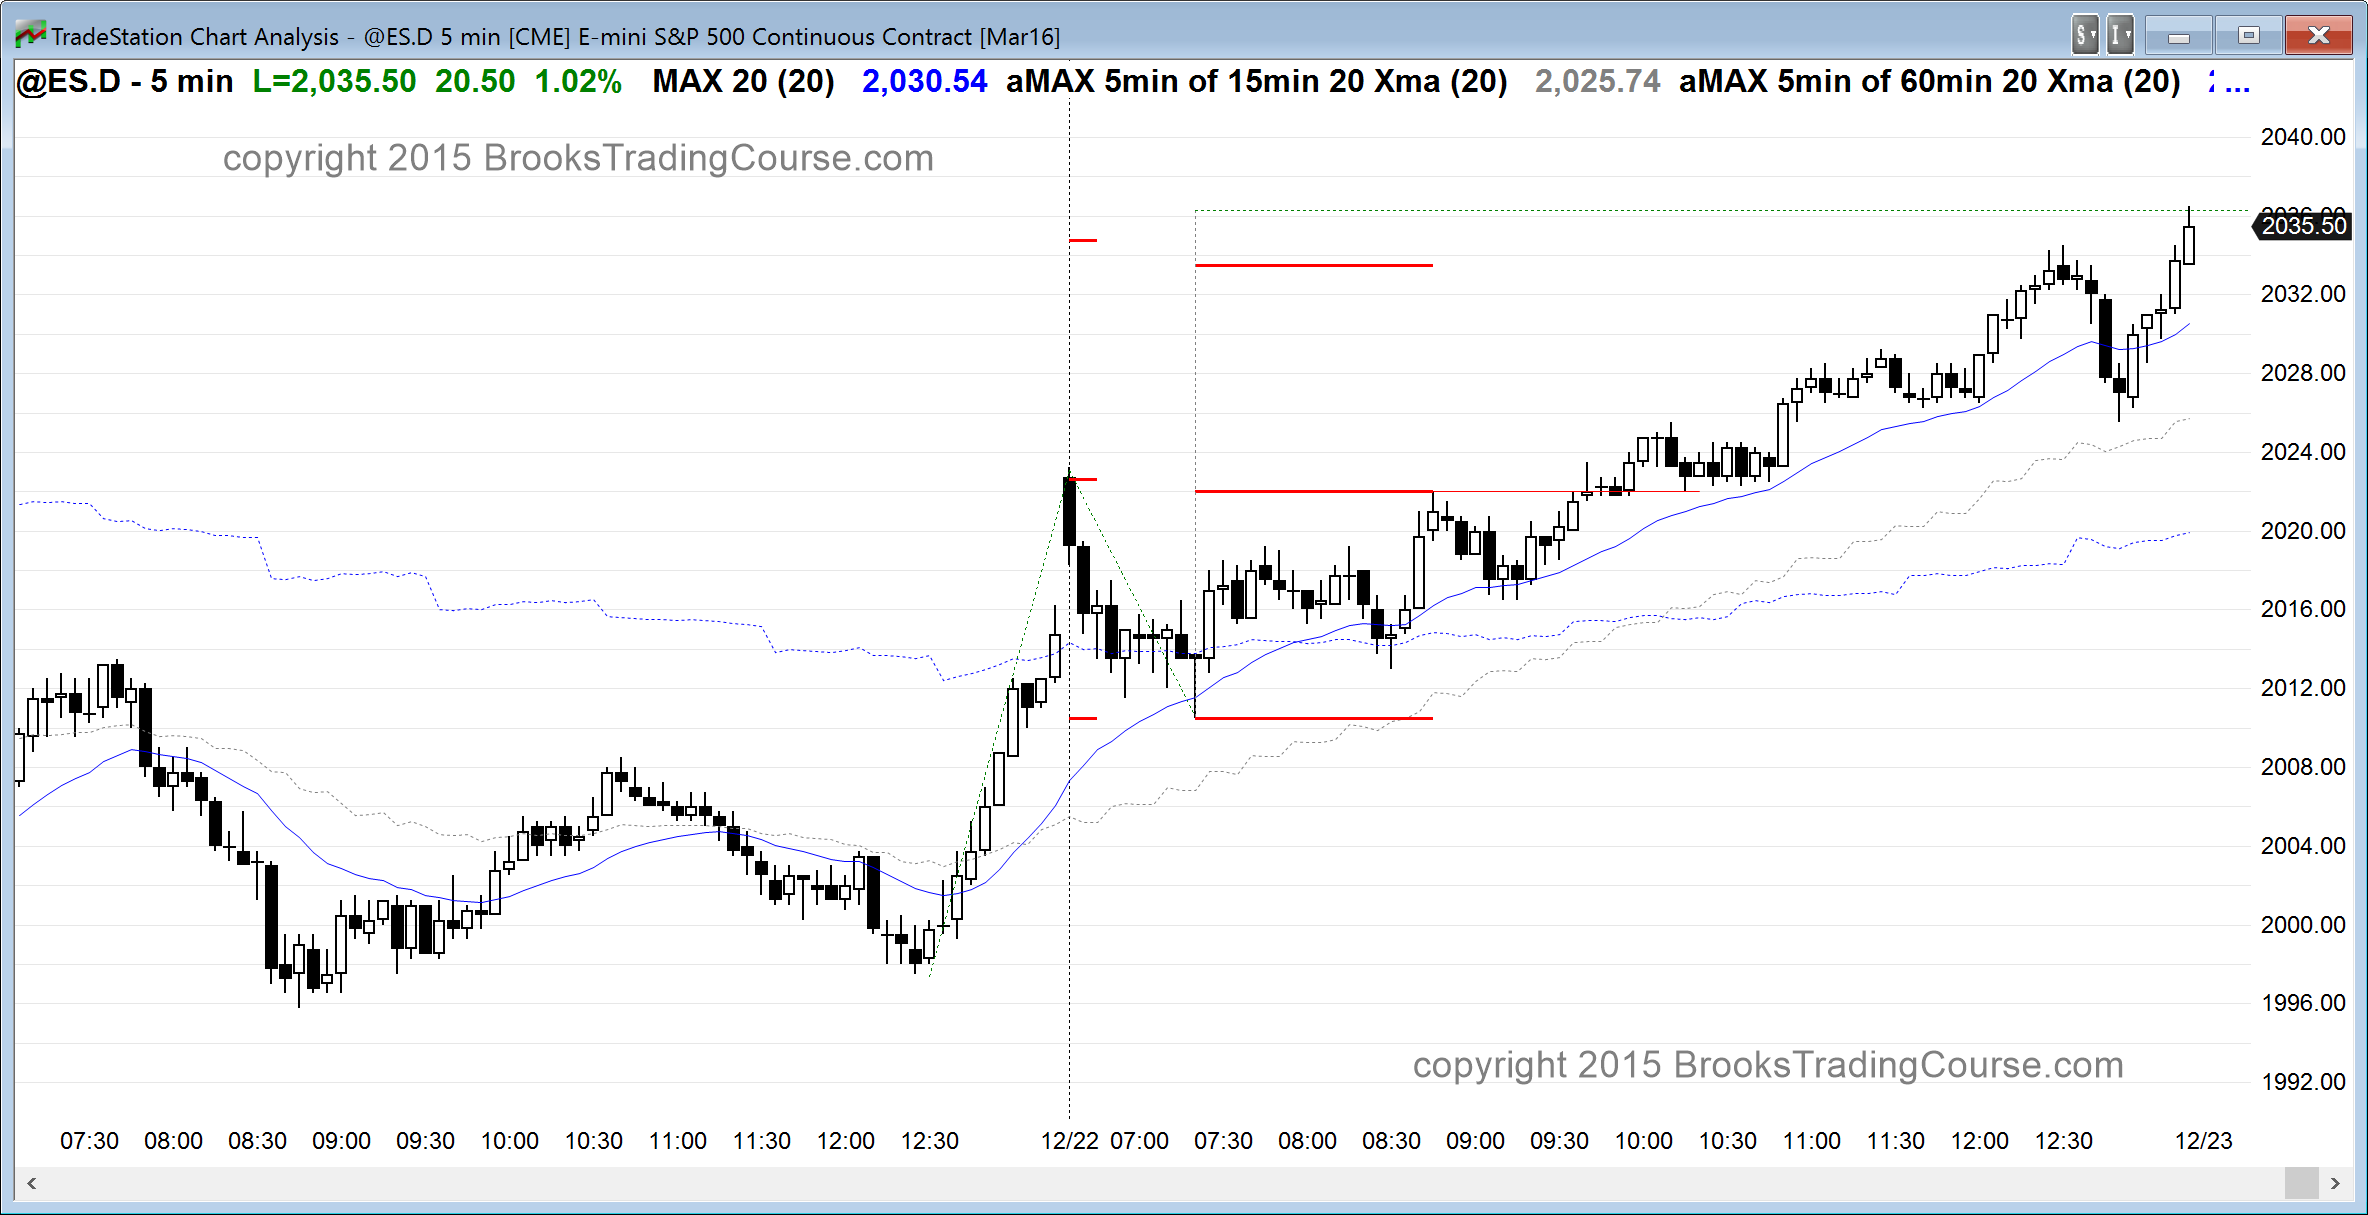
Yesterday’s 5 minute chart reversed up from a double bottom higher low major trend reversal (head and shoulders bottom). This formed at the bottom of the 2 month trading range so the location was also good for the bulls. There was a strong bull breakout at the end of the day. The bulls want follow-through buying today and then a measured move up. The double bottom was 10 points tall, and the rally almost reached the target based on the double bottom. The head and shoulders bottom (the trading range) was about 20 points tall, and its measured move target is 2038, which is close to the middle of the 2 month trading range.
The Emini has been forming lower highs since the all-time high in July. This is a bear trend. The bears have not yet created a bear breakout, so the Emini is still in a trading range. Every trading range also contains a bull trend. The bulls see the bear channel as a bull flag. However, until the bulls begin to get above lower highs, traders believe that the bears have a slightly higher probability of success.
The first major lower high is the Thursday high of 2069.50. The bears need lower highs to be confident that their early bear trend is intact. They put their stops above the last major lower high. If the bulls can get above 2069.50, the bear argument will be weaker and traders will see the Emini as more neutral. They will also believe that the probability will have shifted to slightly in favor of the bulls.
Because the Emini is in a trading range on the daily chart, traders do not have a strong opinion about the direction of the breakout. They continue to buy near the bottom, sell rallies, and take profits after 1 – 5 days.
The Emini is up 3 points in the Globex session. Yesterday’s rally was strong enough for at least some follow-through buying in the 1st hour or two. However, because the Emini is in a trading range on the daily chart, traders know that the probability of disappointment is greater than the probability of much follow-through. They would not be surprised if there was no follow-through buying. They would also not be surprised if yesterday’s rally was a bear trap, and if today reversed down below yesterday’s low.
Because the rally was strong and the context was good for the bulls, the odds are that the 1st 2 hours today will be either a trading range or a bull breakout. There might be a pullback for about 10 bars to support, like to the moving average. If there is an early selloff, traders will pay attention to its shape. If it is a wedge bull flag, a high 2 bull flag, or a double bottom, and it forms a good buy signal bar at the moving average, they will enter with a strop above the buy signal bar and hold at least part of their position for a swing up from a possible low of the day.
If instead there is a strong reversal down on the open, traders will conclude that yesterday was just a pause from the selloff on Thursday and Friday. They will see yesterday as a bear flag. They will then either sell the bear reversal as it is forming, if it is very strong, or look to sell a pullback.
Forex: Best trading strategies
I have been saying for several weeks that the EURUSD’s bull breakout of December 3 was so strong that there would probably be a pullback that could last more than a month. I also said that when there is a strong trend reversal, especially when the context is good (here, the double bottom with the April low is good context), there is a 60% chance of at least one more leg up and some kind of measured move up.
Friday was a bull reversal bar at the bottom of the December 7 pullback. It formed a double bottom bull flag. The rally up from that double bottom has not been strong on the 60 and 240 minute charts. This increases the chances that it is only a bull leg in the trading range and that the pullback from the bull trend reversal will last longer. If the EURUSD turns down again this week, the bears will see a head and shoulders top on the 240 minute chart. Those who trade the markets for a living know that 60% of head and shoulders tops are bull flags, and are followed by a bull breakout, even if there is 1st a brief bear breakout. The bears have a 40% chance of a swing down to the bottom of the December 3 bull trend reversal.
If the trading range continues to grow on the daily chart, the probability for the bulls will melt away and it will fall to 50%. At that point, the EURUSD daily chart will be in breakout mode, and the probability for the bulls and bears will be equal.
Because the 3 day rally is more likely a bull leg in the December trading range than a resumption of the bull trend, there will probably be a test back down to the 1.0800 neck line of the 240 minute head and shoulders top. If there is, the bulls will try to reverse the EURUSD up again. The candle stick pattern at that point would be a triangle.
At the moment, there is a 60% chance of a 2nd leg up on the daily chart. It might have already begun. The 240 minute chart looks like it will test down one more time first.
The EURUSD 5 minute chart has rallied in the European session. The rally was in a bull channel after yesterday’s modest bull breakout (spike). The overnight bull channel had 3 pushes up and is therefore a wedge bull channel. A bull channel is a bear flag and it has a 70% chance of a bear breakout. The bear breakout usually leads to a trading range. The bottom of the initial trading range is usually around the bottom of the wedge bull channel, which was around 1.0900. The odds are that the 5 minute chart will begin to go sideways to down early in the US session and begin to form a trading range. Less likely, the rally will continue all day or even accelerate upward.
Summary of today’s S&P Emini futures price action and what to expect tomorrow
The Emini reversed about 50% of the selloff from last week. Today’s rally was in a series of buy climaxes. There is a 50% chance of follow-through buying for the 1st 1 – 2 hours tomorrow, and a 75% chance of 2 hours of sideways to down trading that begins by the end of the 2nd hour. The moving average gap bar after the late selloff will probably lead to an attempt at a major trend reversal in the 1st hour tomorrow. Most major trend reversals are followed by trading ranges and not bear trends.


 Review")


