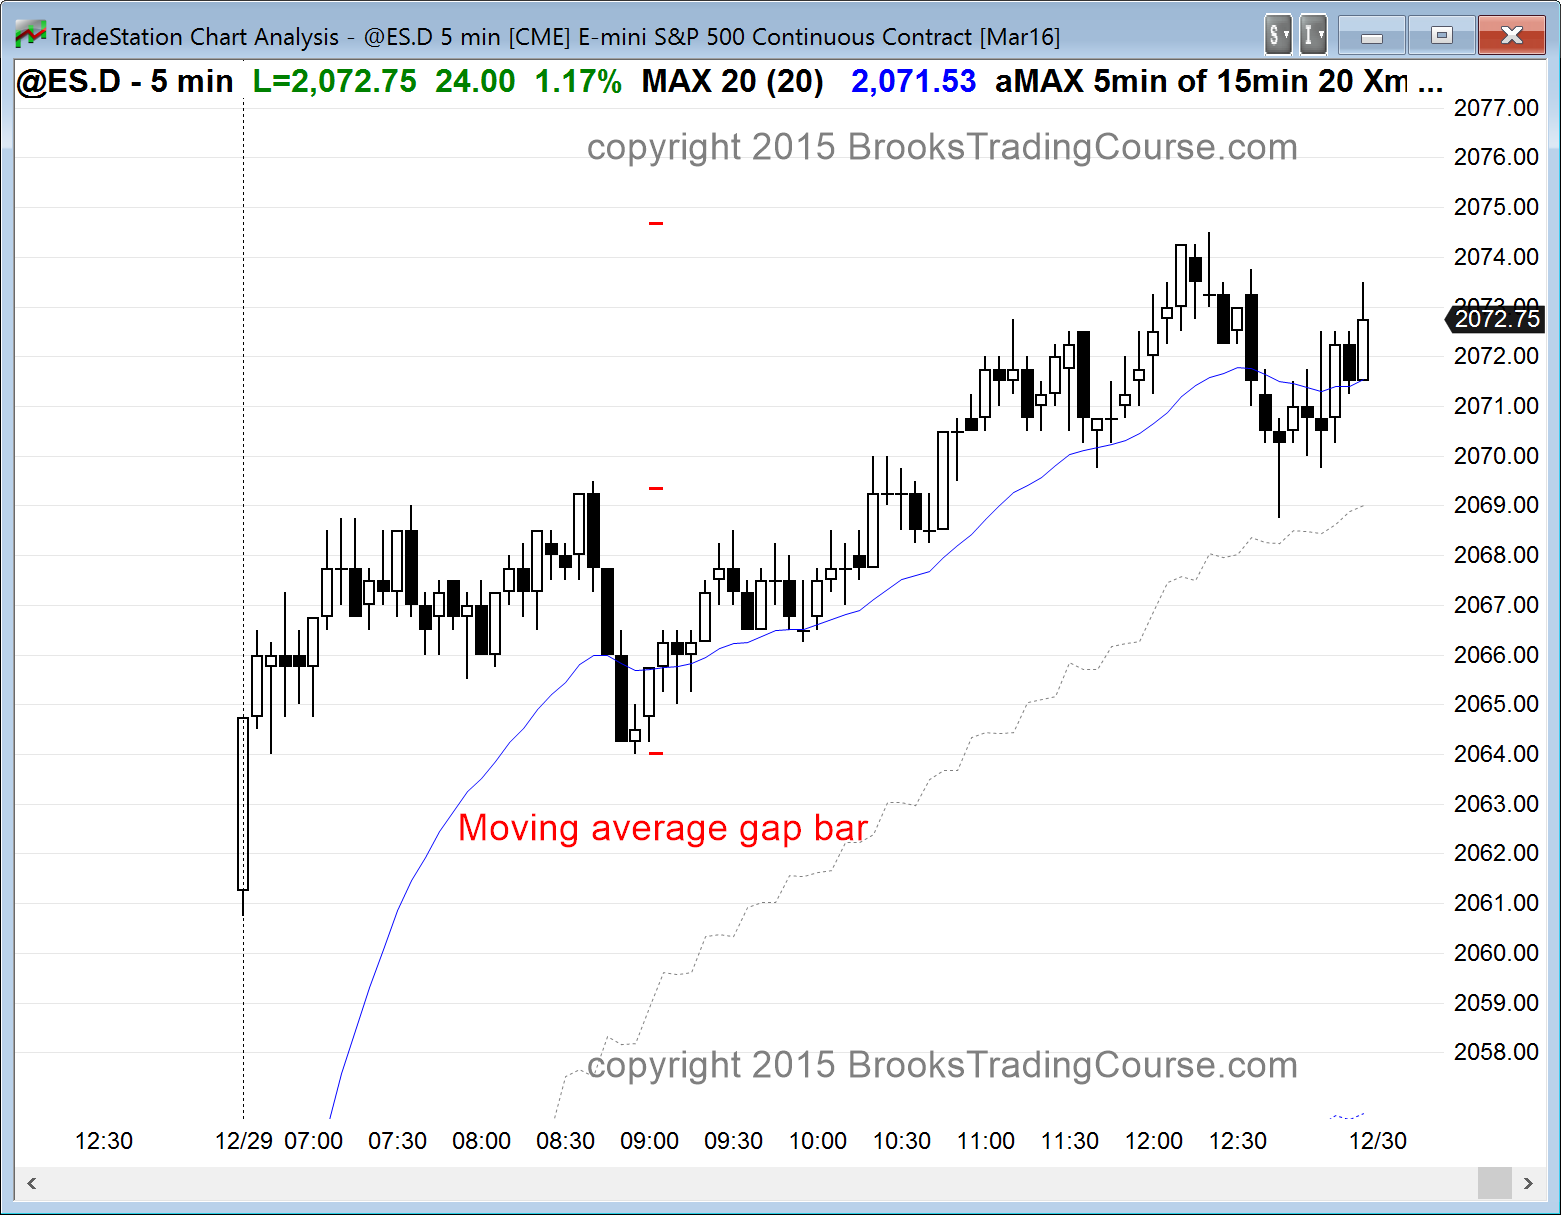
The Emini gapped up, but it quickly formed doji bars. This increased the chances of trading range price action for the next hour or so, and for the rest of the day, whether or not there is a swing up or down in the 1st hour or two.
At the moment, the Emini is Always In Long and the next resistance level is the December 17 lower high of 2069.50. Support is at Thursday’s high, the high of yesterday, and the moving average. Traders can swing trade longs, but many will scalp unless the bull trend becomes much stronger. If the trading range price action continues as the rally progresses, bears will scale into shorts above bars.
Without a clear top or a strong bear reversal with several consecutive bear bars, the best the bears will hope for is an occasional limit order scalp. Because of the dojis and overlap, the best the bulls will probably get is a weak bull channel. If there is a strong bull breakout and consecutive big bull bars, they will be more willing to swing trade.
Pre-Open Market Analysis
S&P 500 Emini: Learn how to trade a break above a wedge top
The Emini rallied most of yesterday in a wedge bull channel. It is up 14 points now in the Globex session and around a measured move up, based on the height of the wedge (yesterday’s range). The next important resistance is the December 17 lower high of 2069.50. The Emini has been making lower highs since July. After the October rally, it has made a series of less significant lower highs in the trading range that followed the October rally. As long as a trading range is making lower highs, the bears can correctly argue that the Emini is in the early stages of a bear trend. Once the Emini goes above a significant lower high, like the December 17 lower high, most traders believe that the bears have lost control. At that point, they see the market as more neutral. For traders to conclude that the bulls have taken control, they want to see higher lows and a new all-time high. Without those, all the market has done is gone from slightly bearish to neutral.
Yesterday was the start of a test of last year’s close of 2020.25. The selloff on the open only got to within 15 points of the target before reversing up. The Emini decided that this year will have a bull body on the yearly chart (a close above the open), and that it will close above last year’s close. It is unlikely that it will change its mind in the remaining days of the year.
What is left to decide is the size of the bull body on the yearly and monthly charts, which close on Thursday. The bulls want as big a bull body as possible. To change the appearance from a doji candlestick pattern with a small bull body to a bull trend bar, the Emini needs to make a new all-time high above 2109.25 by Thursday’s close. That is about 50 points above the current price. That is a distant target for 3 days in a holiday week, but traders who trade the markets for a living will swing trade if the momentum to the upside is strong. If the Emini is 20 or more points from its target by the end of tomorrow, the bulls will probably give up on reaching their target. If they give up, their profit taking would cause a pullback on Thursday, and it would leave both the monthly and yearly candlestick pattern as dojis.
Today will probably gap up. The bulls will buy the open and any early pullback, hoping to create a rally that will reach a new all-time high by the end of the week (Thursday). They want the gap to be a measuring gap and for the Emini to reach a measured move up, which would be above the all-time high.
The bears will sell the gap up and any early rally. They want the gap up to be an exhaustive buy climax and the end of the 6 day rally. Traders learning how to trade the markets should be open to anything. When there is a big gap up, the most common thing that the market does is go sideways for an hour or two until it gets closer to the moving average. It then decides whether to reverse down from a double top or a wedge top, or resume up from a double bottom or a wedge bull flag. There have been many gaps up and down over the past 3 weeks, and each has closed within a few days. That is the most likely outcome when there is a gap in a trading range.
If there is instead a strong sell signal bar on the open, bears will sell below its low, hoping for a swing down. If there is a big bull trend bar or 2 or more consecutive big bull trend bars, bulls will buy closes, hoping for a trend from the open bull trend.
Forex: Best trading strategies
I mentioned yesterday that the rally on the 60 minute and daily charts from the December 17 low was weak and therefore more likely part of a trading range than the start of a 2nd leg up from the December 3 bull trend reversal. I also said that the EURUSD was likely to test back down to the 1.0800 bottom of the month-long trading range, and that is might have to break strongly below the range before the bulls come back to create the 2nd leg up. The selloff over the past hour was strong enough so that there is a 60% chance of follow-through selling today. This might be the start of a test down to 1.0800, which could get tested by the end of the year (Thursday). The selloff is back to the middle of the 5 day trading range, which is a common area for bears to take partial profits and for bulls to buy for scalps. However, it was strong enough so that a 2nd leg down is likely after any trading range or rally.
Less likely, this is just a sell vacuum test of the 50% pullback area, and the bulls will they reverse the EURUSD 5 minute chart up strongly. For traders to conclude that this is the case, they need to see a rally back above the top of the bear breakout that began an hour ago from just above 1.0970.
Traders today will probably look to sell a rally for a swing down. If the EURUSD enters a trading range, bears will then mostly scalp their shorts. Bulls will also look to scalp from the long side.
Summary of today’s S&P Emini futures price action and what to expect tomorrow
The Emini rallied above the December 17 lower high, which weakened the bear case for a broad bear channel on the daily chart. The bears needed to continue to make lower highs. The next resistance is the open and high of the month. Thursday is the last day of the month and the bulls would like a close above the open of the month to create a bull body on the monthly bar. They would prefer a close on the high and even a new all-time high. The bears want the 2 month trading range to continue, and they would prefer December to close near its middle. This would create a doji candlestick pattern, and it would represent a more balanced, less bullish month. The momentum is up on the 5 minute chart and there are targets above, but the 5 and 60 minute charts are overbought, so traders will be ready to sell a reversal down, if one forms.
See the weekly update for a discussion of the price action on the weekly candlestick chart and for what to expect going into next week.


 Review")


