
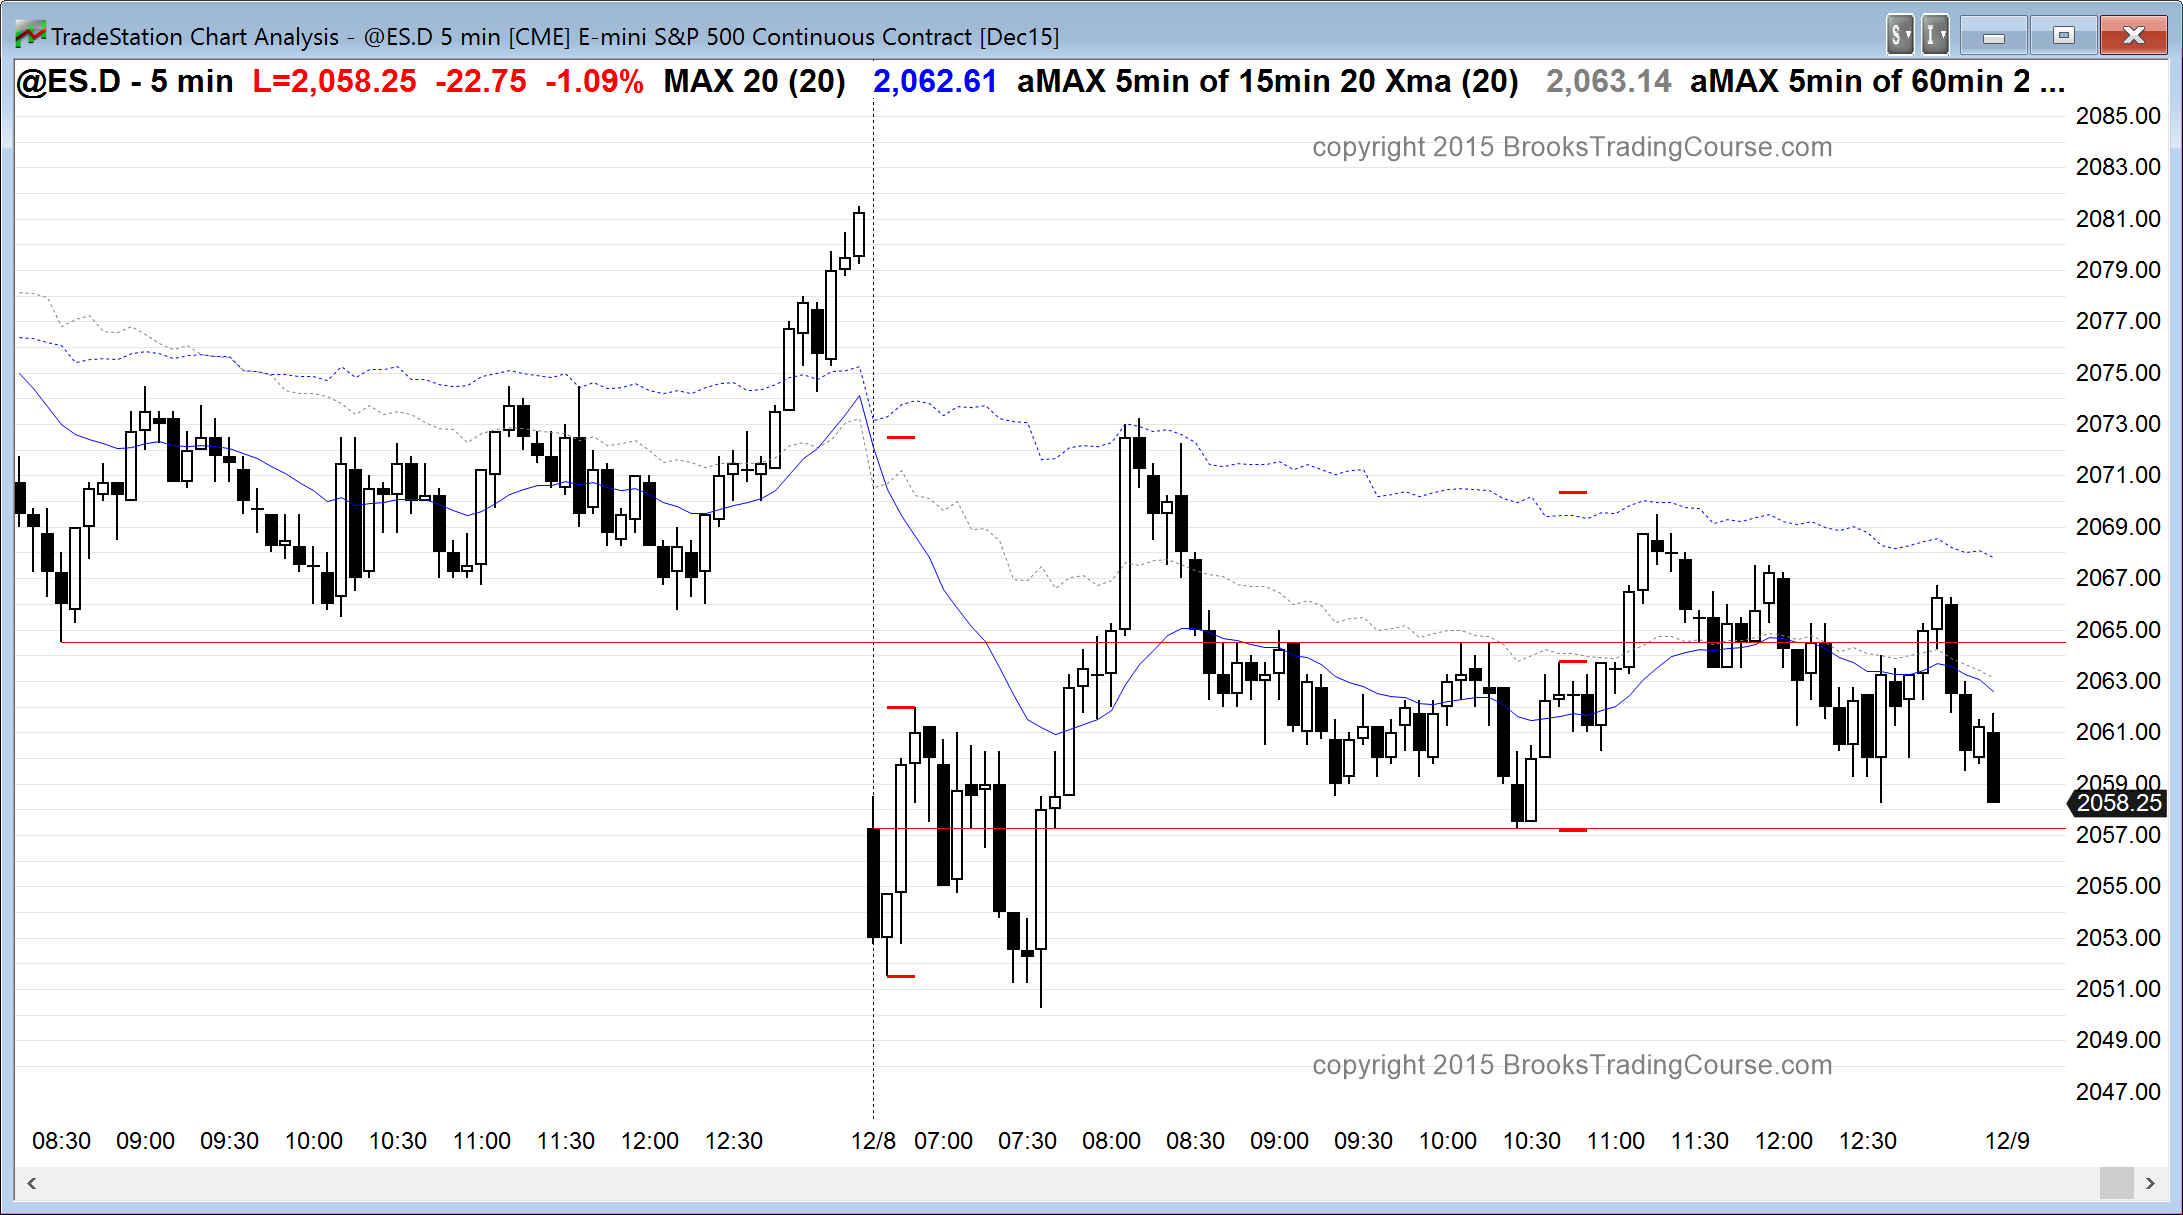
The Emini gapped below yesterday’s low and sold off on the 1st bar, but reversed up strong strongly. The follow-through has been disappointing, which is a reminder that yesterday’s trading range price action and the trading range price action on the daily chart are still important influences. This increases the chances for a lot of trading range price action again today.
At the moment, the Emini is Always In Long, despite the 3 big bear bars. There is a 60% chance that we have seen the low of the day. This means that today will probably either be a trading range day or a bull trend day. With the big bars and big reversals, the odds are against a big trend day, especially since the daily chart is at the apex of a triangle. A lot of trading range price action is more likely.
There is still a 40% chance of a new low, but with all of the trading range price action and with the Emini being far below yesterday’s trading range, the odds are that a new low will be bought and that a trading range would be more likely than a bear trend day.
If there is a strong breakout up or down with follow-through, the day could become a trend day. Until then, traders will take quick profits and expect mostly sideways trading.
Pre-Open Market Analysis
S&P 500 Emini: Learn how to trade a sell signal on the daily chart
The Emini had a strong selloff yesterday and then about a 50% pullback at the end of the day. The Emini is down about 20 points in the Globex session, around the leg 1 = leg 2 measured move projection. The daily chart has had 3 pushes up in the month-long trading range. That is a triangle. The Emini is in breakout mode and has a 50% chance of a breakout to a new all-time high and a 50% chance of a test of the August low. It is easy to assume that the probability is higher when there is a strong bull swing, like in October, but trading ranges always have strong swings up and down. Until there is a breakout, traders learning how to trade the markets should realize that there is no breakout. Those who trade the markets for a living (but not most of the “experts” on TV) know that the probability is still only 50%.
The sell signal on the daily chart triggers is today trades below yesterday’s low. However, since a triangle is a tight trading range, the probability that this is the start of the test down to the August low is less than 40%. The bears need consecutive big trend bars and they need the Emini to break below higher lows, like the November low. Even then, the Emini still is in the yearlong trading range until it breaks below the August low. However, if there are consecutive big bear bars, traders will short looking for at least a measured move down to around the August low.
The weekly chart had dojis for each of the past 2 weeks and last week had a big range. This week might be an inside bar and another doji bar, especially since the Fed will make a market moving announcement on December 16. The Emini might try to be completely neutral going into the announcement, even though there is a consensus that the Fed will raise rates and say that they will be slow to raise them again. Yesterday had a lot of trading range price action, as does the weekly and monthly chart, and the Emini probably will continue to have trading range price action going into the report. However, it is a mistake to assume that the breakout has to wait for the announcement. It can come at any time and it can be very big.
On the 5 minute chart, there can be huge breakouts lasting 10 or more bars, and the breakouts can come as reversals, making it difficult to believe that they will be successful. The day trading tip is to be open to anything and be ready to swing trade any especially big move in either direction, especially if you feel it should not be happening at the moment.
Forex: Best trading strategies
The daily chart of the EURUSD had a big bull breakout above a bear channel and a double bottom with the April low. The breakout was strong enough so that there is a 60% chance of follow-through buying after a pullback. There was a 2 day pullback and the EURUSD traded above yesterday’s high last night. That is a breakout above a 2 day bull flag and a buy entry.
However, the bull breakout was so big that the pullback might continue for several weeks and fall more than 50%. This means that traders who are long or who are buying above yesterday’s high still need their stop below the December 3 low at around 1.0535. That is 350 pips below. When the risk is that big, traders have to trade small positions. If there is a more complex pullback, like a wedge bull flag, and it has a strong bull signal bar, traders can then buy above the bar and put their stop just below the bar. Until there is a higher low that has a high probability of leading to a breakout above last week’s high, traders need to use a wide stop.
The 60 minute chart is in a trading range. Day traders trading the chart will look for 50 point scalps up and down. Since the daily chart is strongly up, day traders should focus more on buying lows. Traders on the 5 minute chart should trade each day as it unfolds. There will be swings up and down, despite the probability of a 2nd leg up on the daily chart. The pullback might last a month or more and it might fall 200 or more pips. This means that it could contain several big bear swing trades on the 5 minute chart.
Although the EURUSD has rallied for the past 4 hours in the European session, it is in the middle of the trading range of the past several days, and the 60 minute chart has had 3 pushes up. This is a potential wedge lower high. Day traders on the 5 minute chart should be prepared to short a swing down, if one occurs. More likely, the EURUSD will start to go sideways on the 5 minute chart for at least a couple of hours, and day traders will probably mostly scalp for 10 – 20 pips today.
Summary of today’s S&P Emini futures price action and what to expect tomorrow
As I mentioned this morning, today was likely to have a lot of trading range price action, and it did. This might continue up to next Wednesday’s FOMC announcement. There is no evidence that the Emini will trend before then.
See the weekly update for a discussion of the price action on the weekly candlestick chart and for what to expect going into next week.


 Review")


