Monthly S&P500 Emini futures candlestick chart: Double top
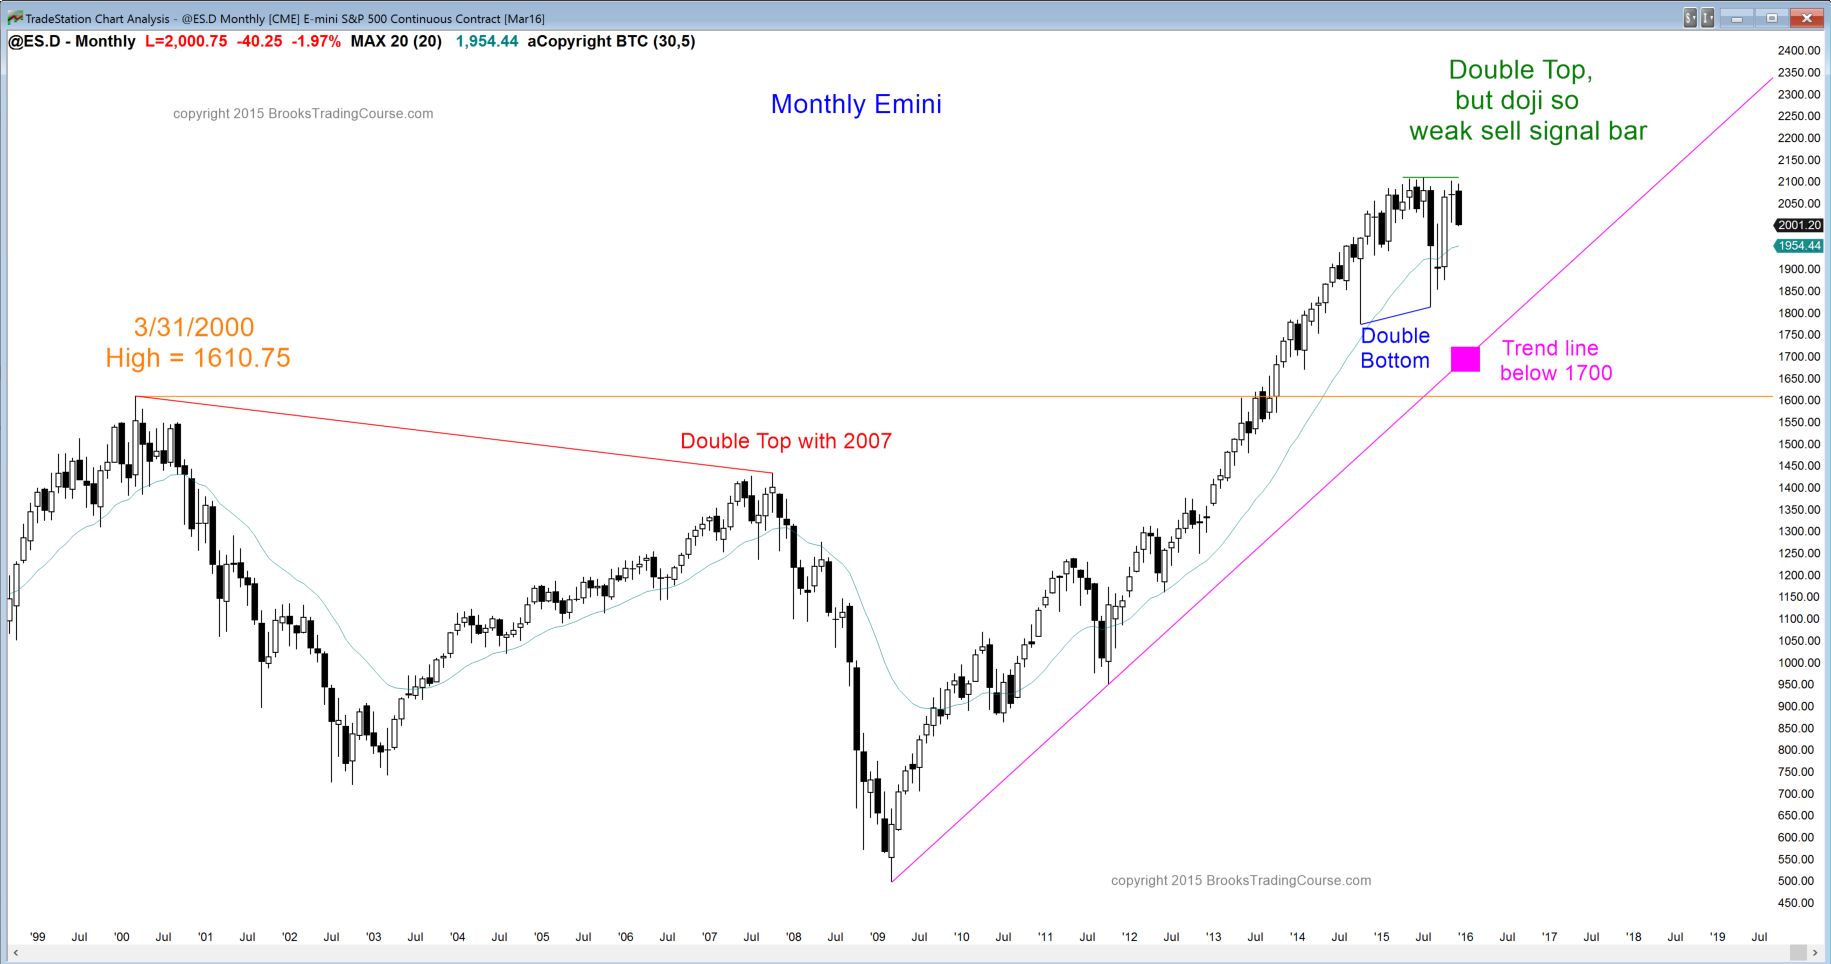
The monthly S&P500 Emini futures candlestick chart traded below the November low. This triggered a monthly sell signal for a double top with the July all-time high. November was a doji candlestick pattern, and therefore a low probability sell signal bar. However, the double top is forming in an unusually overbought monthly chart. August was the 1st test of the moving average in 38 months. The S&P500 cash index has only been completely above its monthly moving average for 38 months twice in 50 years. In 1987, the market fell 36% afterwards. In 1998, it fell 22% after holding above the average for 44 months. The sample size is small, but traders who trade the markets for a living know that the stock market and many major stocks are overbought. This can lead to a bigger correction than what might seem likely.
Although the monthly chart is in a bull trend, there is a 50% chance of a breakout to a new all-time high before a test of the August low. There is a 40% chance that the Emini will break below the August low before it breaks to a new all-time high. Because the bull trend is so extremely overbought, there is a 30% chance of a 20% correction, which would test the monthly bull trend line that is around 1700, and the double top of 2000 and 2007.
Weekly S&P500 Emini futures candlestick chart: Lower high major trend reversal
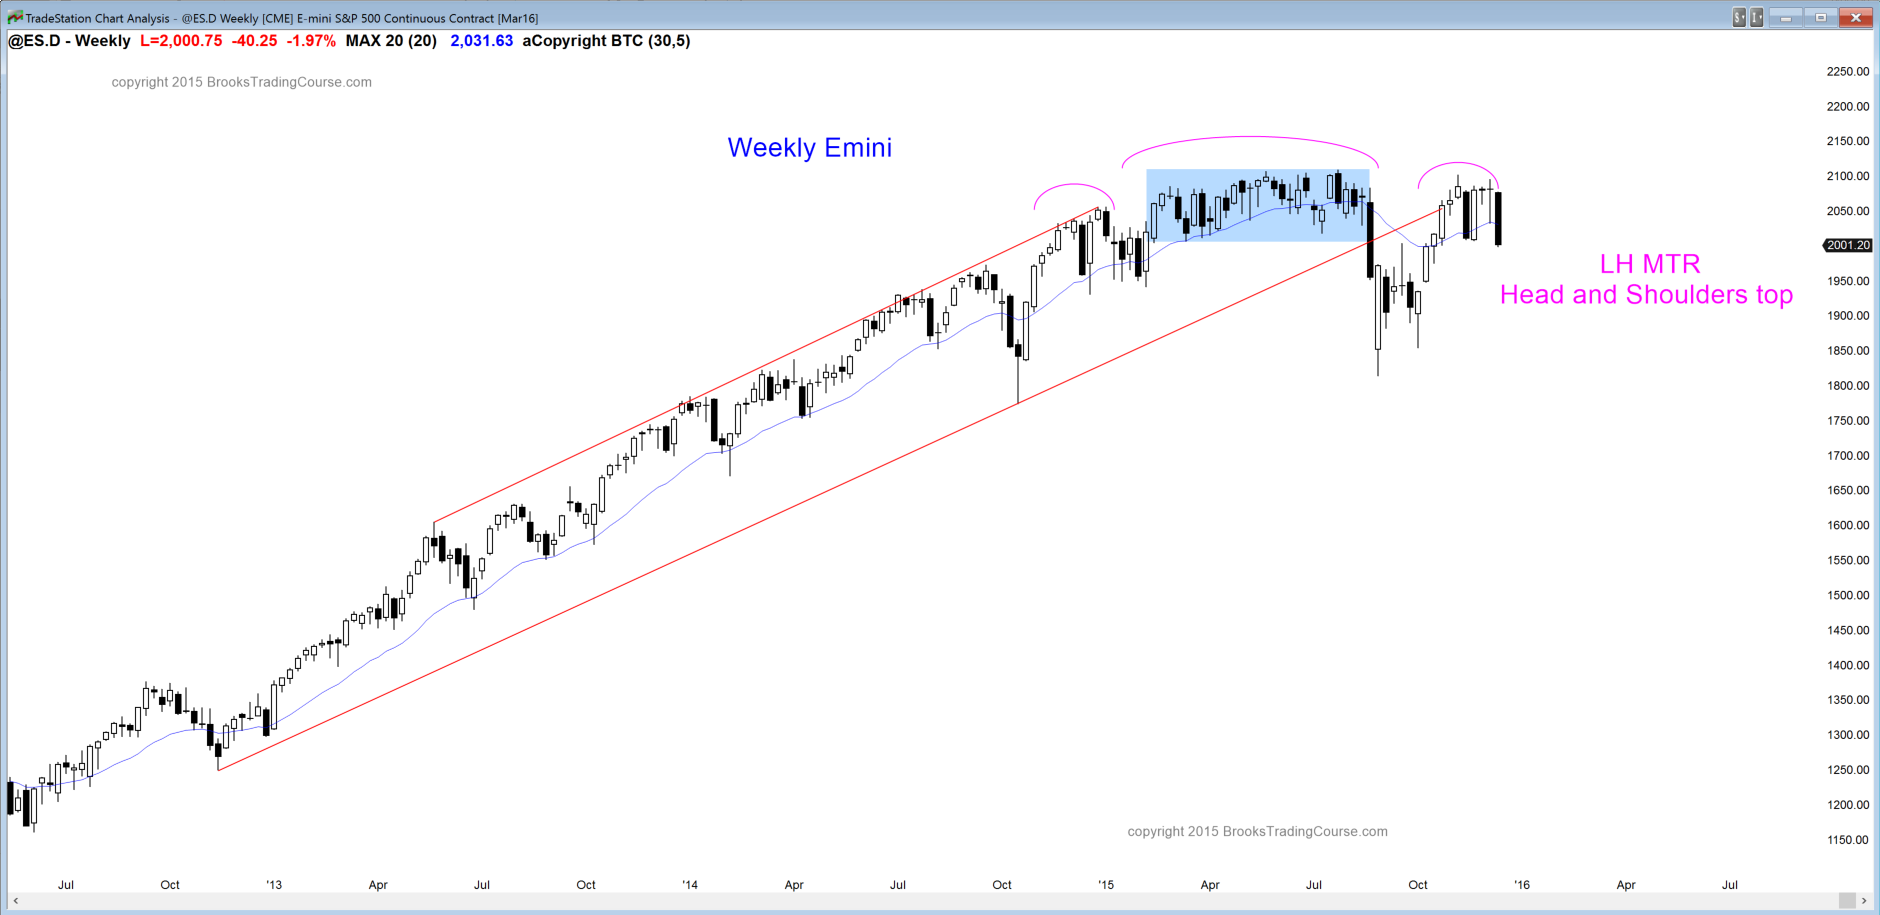
The weekly S&P500 Emini futures candlestick chart had a small double top over the past few weeks, and it created a 2nd entry sell for lower high major trend reversal. This was also a head and shoulders top. A major trend reversal has about a 40% chance of a swing trade down to a measured move target. The height of the 2 month trading range was about 100 points, and that is the minimum target for the bears. In 60% of cases, the market does not reach the target and instead enters a trading range or reverses up.
This week was a strong bear breakout and it fell below the September high and below 2,000. The bulls should not have allowed that to happen after the successful test of this support during November’s pullback. It lowers the probability of a bull breakout to a new all-time high.
However, even though the Emini fell below the November low, it is still close enough to that low for traders to see this leg down as a possible double bottomwith the low. If it reverses up next week, bulls will also see it as a big high 2 buy setup (ABC pullback from the October high). Unless the Emini breaks strongly below the support of the September high, traders will see the past 2 months as still being in a trading range, and they expect it to go mostly sideways into Wednesday’s Fed announcement about interest rates. That report could lead to a strong breakout to either a new all-time high or a test of the August low. Until there is a breakout, there is no breakout, and there might not be a breakout on the report. Most traders are still neutral and waiting for a breakout up or down.
Daily S&P500 Emini futures candlestick chart: Learn how to trade a sell signal
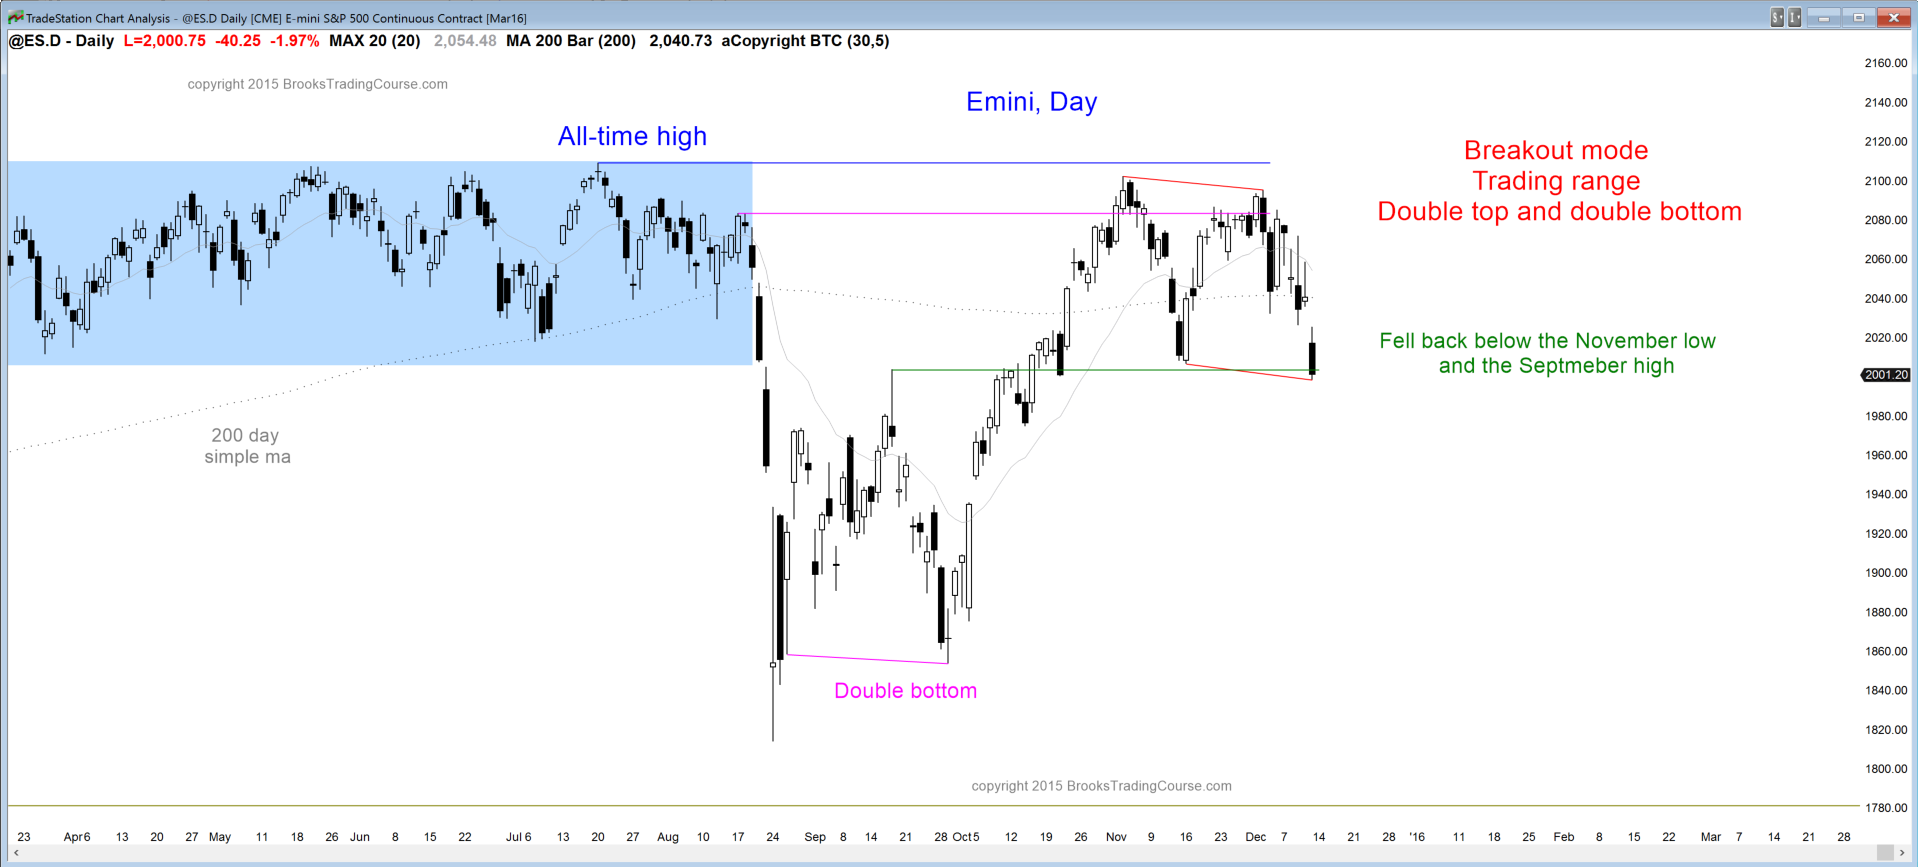
The daily S&P500 Emini futures candlestick chart on Friday fell below the November low, which is the neck line of a double top. This triggered a double top sell signal. The bears need follow-through selling next week. The stronger it is, the more likely they will get a measured move down and possibly a test of the August low. If they get a big bear trend bar or a series of big bear trend bars next week, the chance of a measured move down could quickly become 60%.
The Emini also closed below the September high, which was the neck line for the August-October double bottom. It tested this breakout point in November. The bulls did not want Friday’s 2nd test down to fall below support because that weakened their argument that the rally from the August low is still intact. Instead, it made a trading range more likely than a bull trend.
It also strengthened the case for the bears, who see Friday’s fall below the November low as a breakout below the neck line of a double top. If the Emini reverses up next week, the bulls will see the reversal up as a large high 2 buy setup with the November low, and a double bottom with the November low where the 2nd bottom fell a little below the 1st. The bulls want a strong reversal up next week so that the bears will give up their hopes of a measured move down, and instead conclude that the selloff was simply a bear leg in a 2 month trading range.
Since the Emini is testing major support and there is an important report on Wednesday, next week might have a strong bear breakout or a strong bull reversal. It can come before or after the report. Most likely, there will be a bounce early in the week because the daily chart is oversold and at support, and the bears failed to get a strong breakout below the support.
See the weekly update for a discussion of the price action on the weekly candlestick chart and for what to expect going into next week.


 Review")


