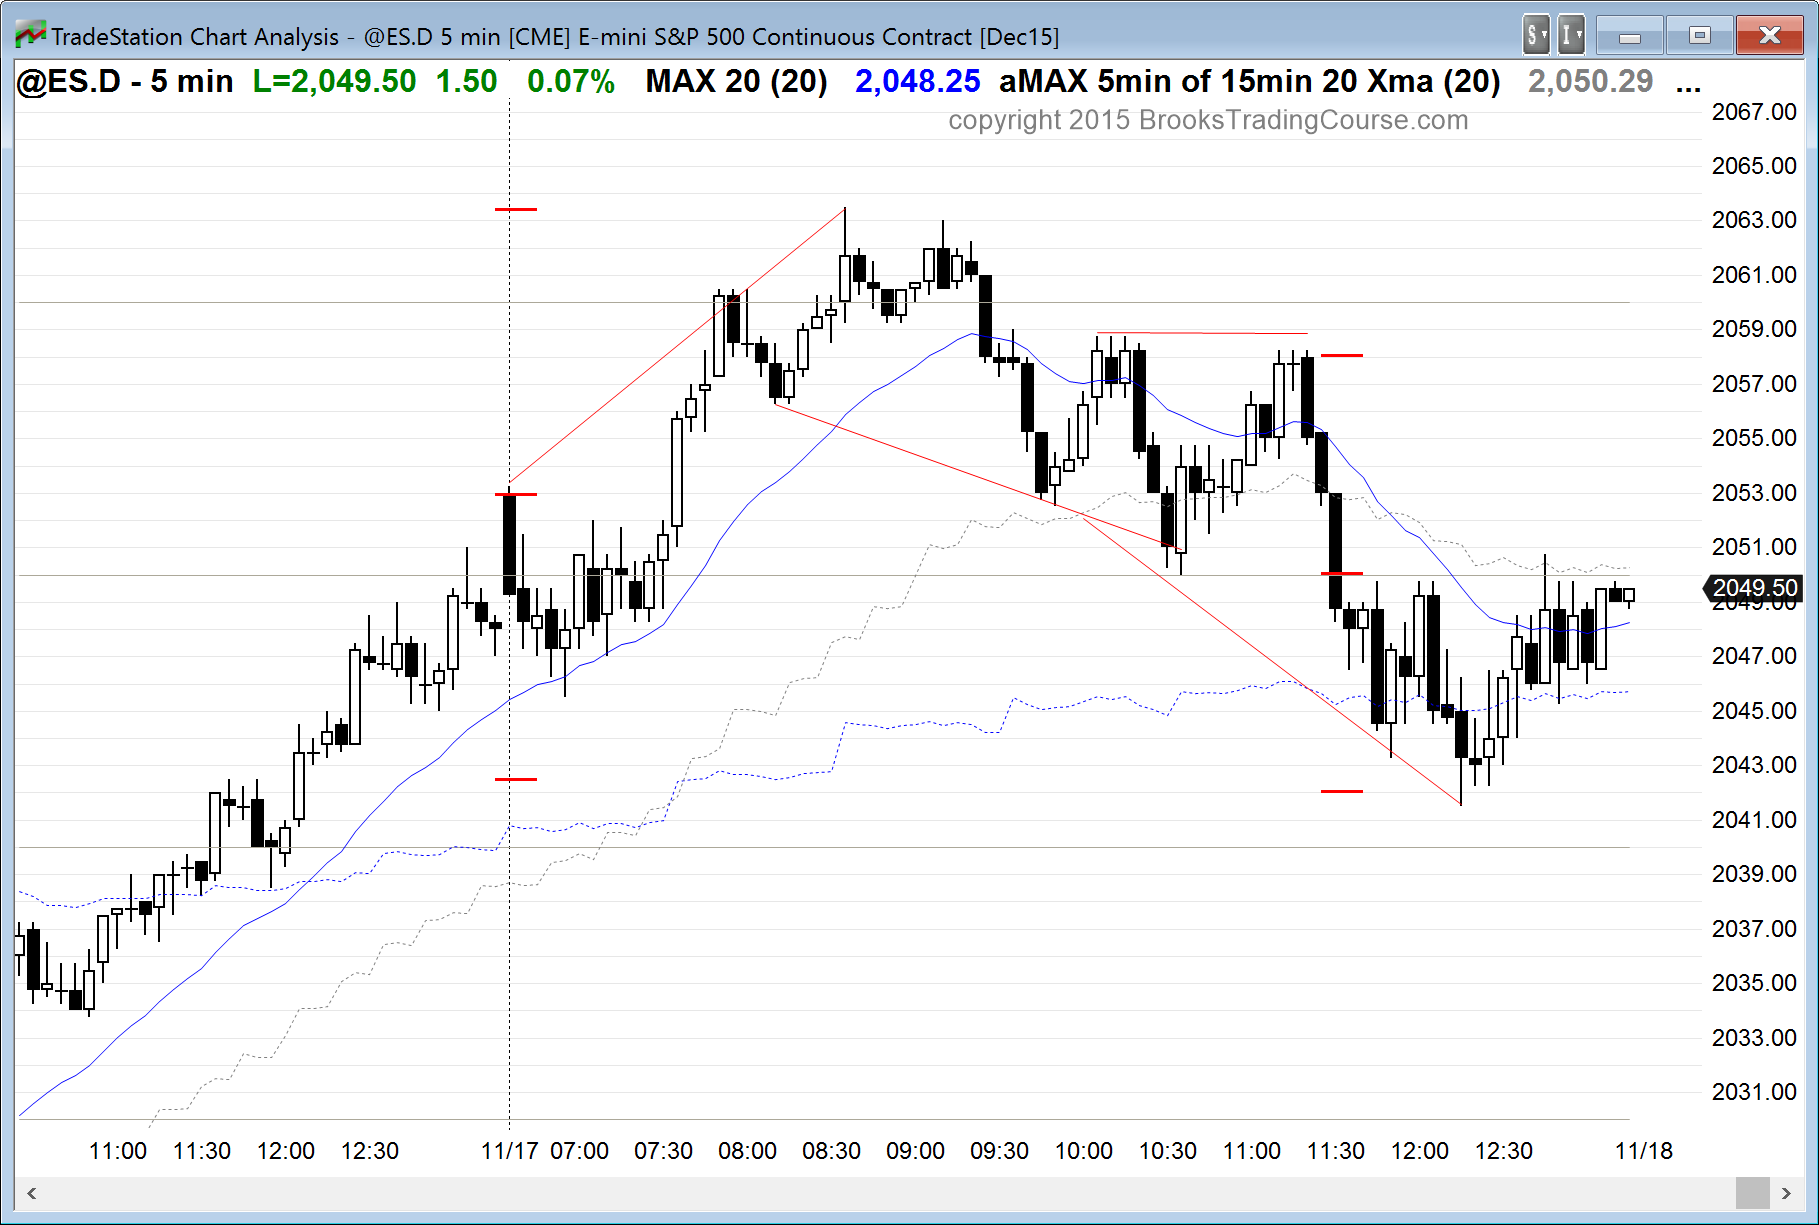
The Emini had a reversal down from above yesterday’s high and then an opening reversal up from the moving average. This created a breakout mode environment. Until there is a strong breakout up or down with strong follow-through, traders are quick to take profits and are selling above bars and buying below bars for their scalps. The bears want a lower high major trend reversal and the bulls want an opening reversal up from the moving average.
Traders know that any rally will probably be limited to 1 – 2 hours, and that any selloff will probably be less than 3 hours. However, they know that a swing is likely and want to enter early because they believe it will only last 2 – 3 hours. If a swing ends within 2 – 3 hours, a trading range day is likely. Regardless of what happens, the bulls will try to get trend resumption up in the final hour as follow-through from yesterday’s strong bull trend. Traders should watch for a possible a buy setup or bull breakout late in the day.
Pre-Open Market Analysis
S&P 500 Emini: Learn how to trade after a buy climax
The Emini was in a tight bull channel for most of yesterday. That is climactic price action. There is a 50% chance of follow-through buying for the 1st hour or two today, and a 75% chance of at least 2 hours and 2 legs of sideways to down price action starting by the end of the 2nd hour.
With yesterday’s rally as strong as it was, a strong bear trend day is unlikely today. The best the bears can probably get is a weak bear trend day, like a broad bear channel or a trending trading range day that retraces about half of yesterday’s rally.
While the bulls can have another strong bull trend day, that is also unlikely because yesterday had a very big range and the daily chart is in a trading range. When the Emini is in a trading range, traders are usually disappointed by follow-through. This means that the bulls today probably will be disappointed by whatever follow-through buying that will come today.
The daily chart had a big rally in October, a big selloff last week, and a big reversal up from support yesterday. A chart that contains multiple strong reversals is in a trading range, especially when this is happening just below major resistance (the all-time high) and in a prior trading range (the 1st 7 months of the year). There is still a 50% chance of a new all-time high over the next few months and a 50% chance of a breakout below the October low.
Since the Emini is much closer to the bull target, the risk/reward favors the bears. With the probability also favoring the bears, the Trader’s Equation is better for the bears over the next couple of months. The bulls have strong momentum up in October, which means that the probability of a test of the November high is likely, and very little room left to their target of a new all-time high. They have the advantage over the next week or so.
Because of the double top on the weekly chart and last week’s strong selloff, those who trade the markets for a living know that yesterday’s rally might result in a lower high, just like the November high failed to get above the all-time high. If yesterday’s rally fails to get above November’s high, they will begin to wonder if these lower highs are a sign that the daily chart is in the early stages of a broad bear channel.
Traders learning how to trade the markets should not only look at the current leg. The context is important. A bull trend needs higher highs. Despite the many big bull trend days since August, the bulls have not yet been above to get above the August high. The reason is that they are not stronger than the bears.
We still do not know how many bear dollars are sitting just below the all-time high. We might soon discover that there are far more than the number of bull dollars. We will not know until there is a strong bull breakout to a new all-time high, or a strong breakout below yesterday’s low with strong follow-through selling.
Forex: Best trading strategies
The daily chart of the EURUSD has had 3 days down from a small bear flag. The selloff from the October 22 bear breakout has had weak follow-through. This means that it is more likely a bear leg in a trading range than a in a bear trend. A trading range has legs down and up. Even though the weekly and monthly charts are in bear trends, the daily chart has had weak momentum in the current test down of the April low. This increases the chances that the current leg down will bounce before it gets to that low. The bears might need a small double top with the November 12 or even the October 30 lower highs before they will be able to get their breakout below the April and March lows.
The 2 month selloff on the daily chart has been in a tight bear channel. A tight channel usually does not reverse into a bull trend. The first reversal up is usually minor and results in a trading range. Once in a trading range, the bulls hope to form a double bottom, which could then lead to a swing up. The bears will see the trading range as a bear flag. If the trading range grows to 20 or more bar, the probability of a bear breakout will drop to the same as the probability of a bull breakout. The market would then be in breakout mode, with each side having a 50% chance of a breakout, and a target equal to the height of the range.
The 60 minute chart has been in a tight bear channel for 4 days, and the 5 minute chart has been trading down for the past hour. If the bulls get a reversal up today or tomorrow, the candlestick pattern would be an expanding triangle bottom on the 60 minute and 240 minute charts. This is a type of major trend reversal, and it has a 40% chance of a swing up to the top of the pattern, which is the November 12 high around 1.0820.
If the bulls fail to get their bottom,, the downside is still probably limited over the next couple of weeks because the selloff has had a series of big bear breakouts on the 240 minute chart. This is exhaustive behavior and the bears usually will take profits and wait to sell higher. A big trading range usually follows a big series of sell climaxes. A big trading range on the 240 minute chart would probably last at least a week or two.
The 4 day selloff might continue today, but it is more likely that the day will be mostly sideways. The EURUSD is oversold on the 5 minute chart, and the context is good for a reversal attempt over the next few days. That could lead to a test up to the 1.0820 top of the expanding triangle next week.
Summary of today’s S&P Emini futures price action and what to expect tomorrow
After a 9 bar bull micro channel on the 60 minute chart, the Emini sold off for 3 bars. The odds are that there will be buyers tomorrow and the today’s selloff will be followed by a trading range or a rally tomorrow. Today’s 5 minute bear channel will probably be a bull flag and have a bull breakout tomorrow. Because of the 3 strong bear bars on the 60 minute chart, the Emini will probably be sideways tomorrow. The daily chart is in a trading range, and reversals after big days are likely.
Original post was published at Al Brooks Price Action Trading Blog. Check Brooks Trading Course and get the most comprehensive source of information on price action trading available!


 Review")


