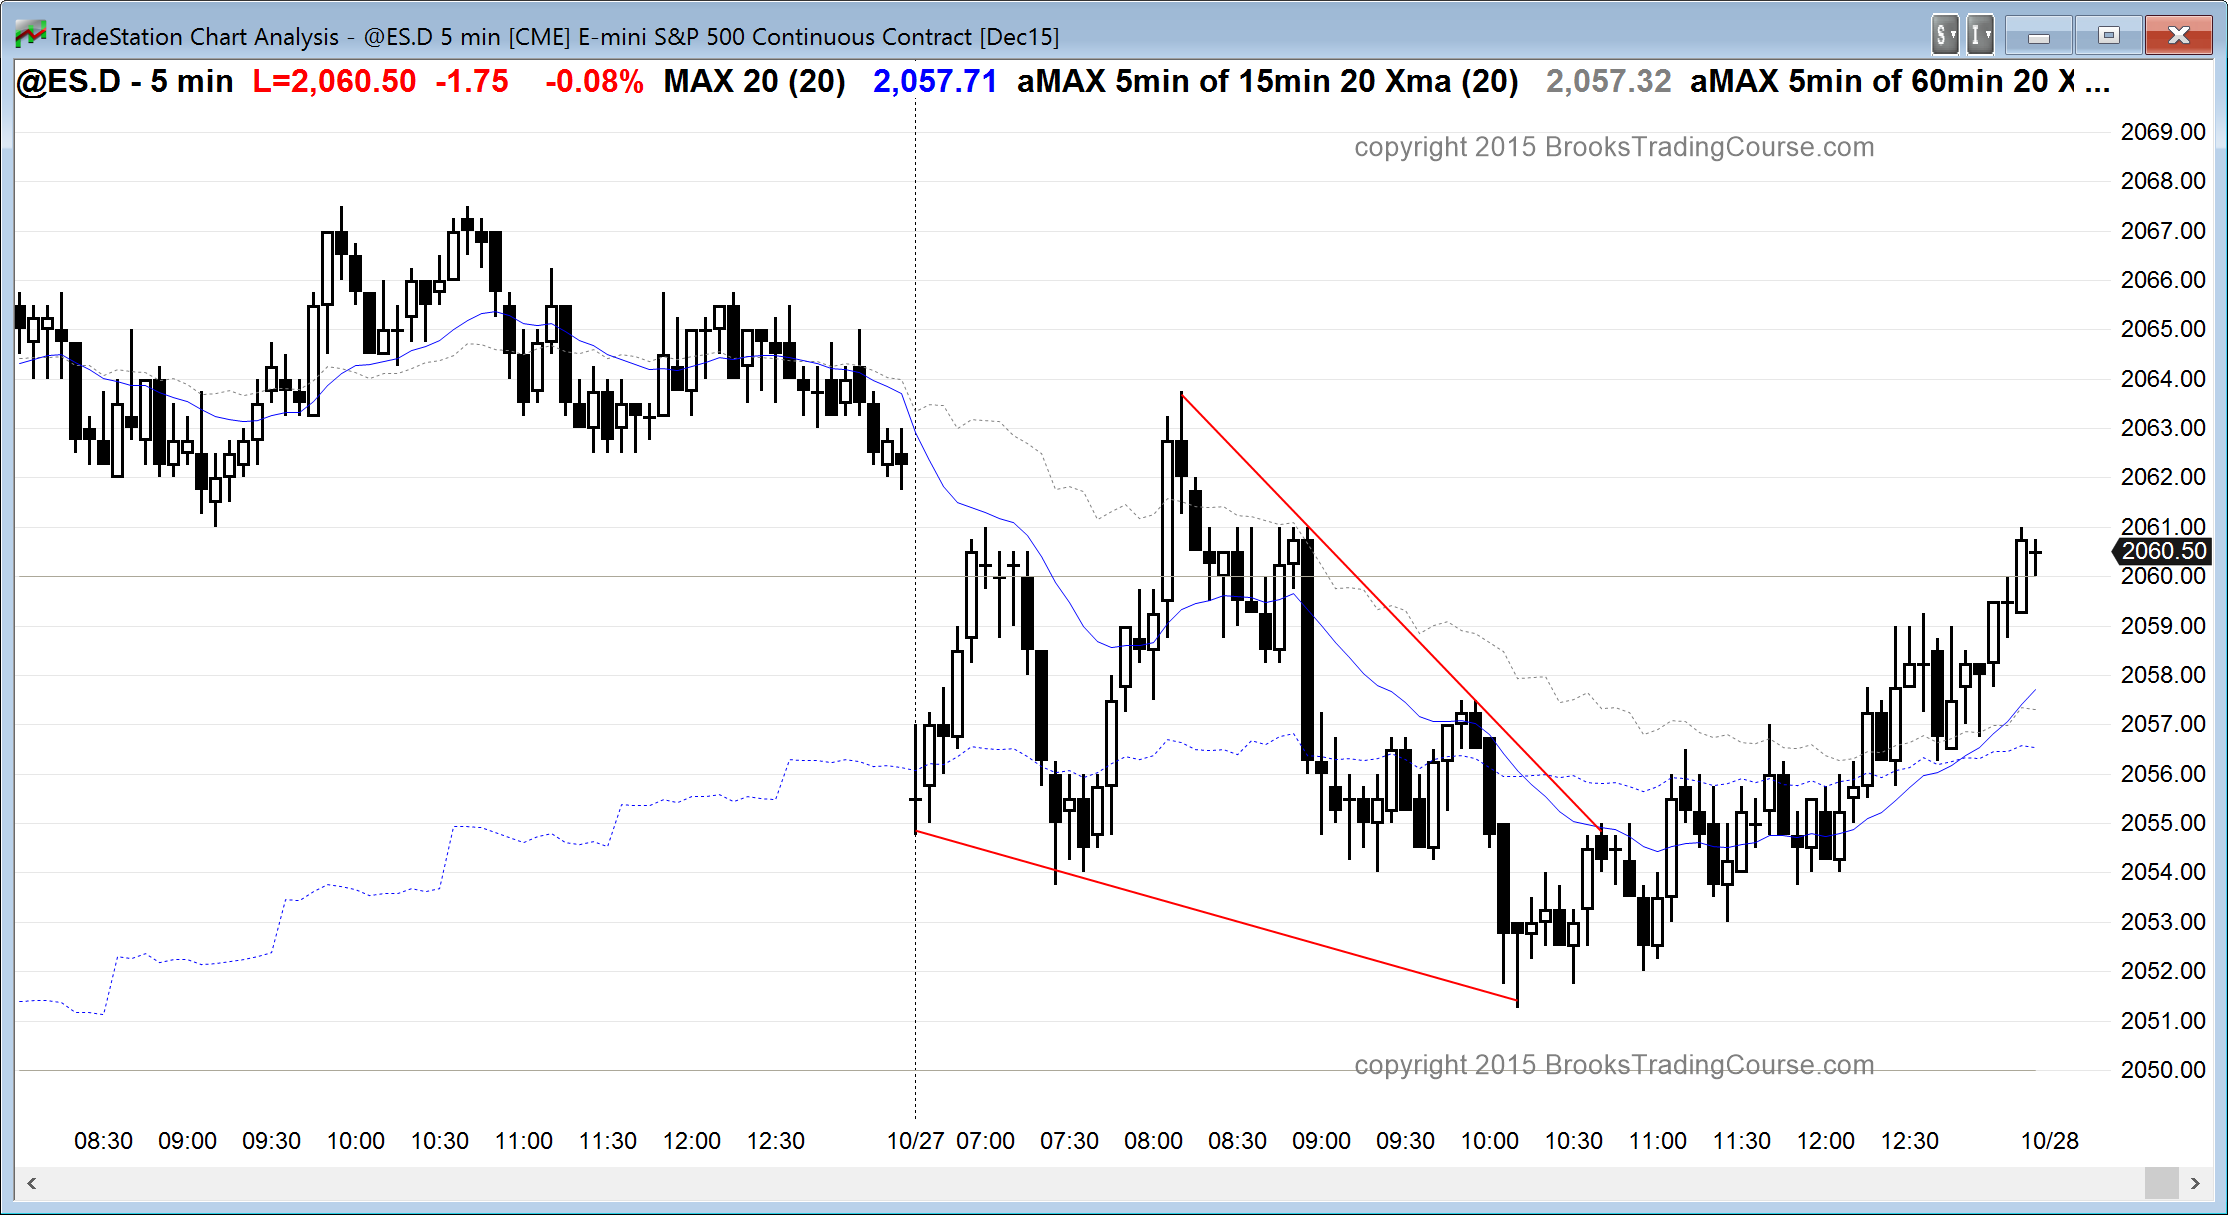
The Emini gapped down and formed a 2 day island top. It reversed up from above the bottom of Friday’s gap up. The reversal was at the 60 minute moving average. The rally was a trend from the open bull trend and it closed today’s gap down by going above yesterday’s low, but stalled at the measured move target and the moving average. The bears reversed the Emini down at the moving average. This created an opening reversal down and a possible early high of the day.
At the moment, the Emini reversed down to a new low of the day and is Always In Short. The bulls want the breakout to a new low of the day to fail and reverse up at the 60 minute moving average. The selling was strong enough so that the odds are that the 1st bounce will be sold and the best the bulls will get is a trading range. If they form a trading range, they then might be able to create a base that could lead to a new high of the day.
The bears want a measured move down, but they need follow-through selling below the 60 minute moving average. Without it, the Emini will probably enter a trading range. Even if today is a bear trend day, it will probably not be strong. The selloff is more likely a bear leg in what will be a trading range day. They are currently in control, and they might be able to create a bear trend day. Tomorrow’s FOMC report probably will make traders hesitant to let the market get too far.
Pre-Open Market Analysis
S&P 500 Emini: Learn how to trade an island top
The Emini continued its pause after Thursday’s buy climax. It was again sideways over night, and it might be waiting for tomorrow’s FOMC meeting before it decides whether it will have another leg up or pull back. The rally on the daily chart from the October low had 3 pushes up, which increases the chances of a couple of legs down to the higher lows of October 14 and 21. The 3rd leg up was a big breakout, which increases the chances of at least one more small leg up after the first small reversal down.
The bulls have momentum working for them. The bears have a buy climax at the top of a yearlong trading range on their side. Although the daily chart is Always In Long, it is overbought and can pullback for several days starting at any time. The past 2 days were small, indicating that the market is satisfied with the current price at the moment. The probability for the bulls over the next few days, including tomorrow’s FOMC report, is the as it is for the bears.
The 5 minute chart formed a triangle over the past 2 days, which is a tight trading range. It is in breakout mode. The probability is the same for the bulls and bears, and the minimum target is a measured move up or down, based on the height of the triangle. It formed late in a bull trend. This means that the probability of a successful bull breakout is probably less than 50%. If the bulls get their breakout, there is better than a 50% chance that it will fail and be followed by at least a few days down. The triangle would then become the final bull flag in the month long rally.
Although the Globex session overnight has drifted down in a broad bull channel, and it just had a small bear breakout, the move is too small overall to be significant without more follow-through. The Emini is down below yesterday’s low. If it opens down here, it will be a gap down and it will create a 2 day island stop. The bears will try to keep the gap open, hoping that it will be the start of a leg down on the daily chart.
Traders learning how to trade the markets should know that gaps up and down are common in trading ranges and most close within a couple of weeks. Many close within hours of forming. The bulls will try to prevent the gap from forming. If it does form, they will try to close it early to prevent the bears from establishing a sign of strength, which would make other traders more willing to sell low.
Those who trade the markets for a living will watch the early momentum up or down. There has been very little momentum for 2 days. If there is a lack of momentum in the first hour, online day traders will assume that today will be another trading range day. If there is a strong breakout with follow-through, day traders will be more willing to hold onto their position for a swing trade.
Forex: Best trading strategies
The EURUSD had a weak sideways to up move after a strong bear breakout. The rally had 3 pushes and it reversed down 15 minutes ago on a report. The bears are hoping that this is the end of the 3 day bear flag and a resumption of the 60 minute bear trend that began last week. Since the 60 minute chart is still in a 2 day trading range, it is to early to know. While there is greater than a 50% chance of a bear breakout of the bear flag, there is at least a 40% chance of a bull breakout above the bear flag and then a measured move above the October 23 lower high on the 60 minute chart. Like all financial markets, it might continue in a trading range until after tomorrow’s FOMC report.
The USDJPY is oversold on the 60 minute chart, and it is now finding support at the October 23 higher low. The selloff of the past few days lacked consecutive big bear trend bars and it held above the bottom of the October 22 strong bull breakout. This makes it more likely that the selloff is a bull flag and that it will reverse up today or tomorrow. The minimum target is a 50% correction of the selloff, which is also a test of the October 26 lower high. This is about 60 pips above the current price.
Summary of today’s S&P Emini futures price action and what to expect tomorrow
Today was the third trading range day after last week’s buy climax. The Emini is probably waiting for tomorrow’s FOMC report before deciding on the direction of the next breakout. Breakouts up and down reversed all day today, and the result was a trading range day.


 Review")


