Today began with a limit order open. Yesterday ended with a high low major trend reversal. The bulls wanted a rally on the open. There are nested wedge tops on the 5 and 60 minute charts. The bears see yesterday as the first leg down. Yesterday’s low is an entry for a short on the daily chart for a Low 5 sell (a type of Low 4 top), and the bears want today to trigger the short by falling below yesterday;s low. The target for the bulls is also close, at the all-time high. The Emini has been sideways for 2 days and tomorrow is a catalyst for a move up or down. The odds favored a trading range day today.
The Emini broke above yesterday’s trading range (neck line of the head and shoulders bottom), but reversed down, creating a lower high major trend reversal top after nested wedge tops on the 60 minute chart. The bears need to trade below yesterday’s low to trigger a minor sell signal, which more likely would be followed by a trading range for a couple of weeks than a bear trend.
The reversal down was strong enough to make the Emini Always In Short. While it still might be a trading range day, it is not likely going to be a bull trend day. The bulls would need a base and a strong reversal up. The bears want to trigger the sell on the daily chart by falling below yesterday’s low. Today will probably either be a bear trend day or a trading range day. Traders will look to sell the 1st rally. Because of the 2 day trading range and the lack of a strong bear breakout below, the bulls still might get a trading range day However, the selling has been strong enough and the context is good enough so that today might trend down all day.
Pre-Open Market Analysis
S&P 500 Emini: Learn how to trade before a catalyst
Tomorrow is the unemployment report and the Emini is only 14 points below the all-time high, which is major resistance and therefore a magnet that is pulling the Emini higher. Those who trade the markets for a living know that it is also overbought on the daily and 60 minute chart, which limits the upside. The result of 2 opposing forces in the face of a major catalyst usually is a trading range. There is always a chance of a strong breakout to a new all-time high today, and an equal chance of a strong sell-off, but the 60 minute chart has been sideways for 3 days, and it is likely to be sideways again today. The 60 minute bears see a head and shoulders top (lower high major trend reversal), and the bulls see a double bottom bull flag (the 2 pushes down this week that formed the neckline).
Theoretically, the Emini has about the same probability for a new high as it does for a pullback when it is in a trading range. However, the Emini broke above the August top of the bear trend, which was major resistance, and stalled just below the next major resistance. This is more common within trading ranges than it is within a breakout that will go above the higher resistance without a pullback. The odds are slightly greater that the Emini will go sideways to down for the next two weeks that they are that it will successfully break above the all-time high.
Traders learning how to trade should realize that the bulls and bears are both looking for a measured move once the breakout comes. The year long trading range is about 300 points tall. The bulls see the October selloff as forming a double bottom with the October 2014 selloff. The bears see the rally from the October low as being a test of the all-time high, and therefore the 2nd rally in a yearlong double top. The Emini is at the top of the trading range and has strong bull momentum.
However, unless there is a bull breakout, this rally might end up being seen as a buy vacuum test of resistance and the final buy climax in a 6 year bull trend. With the momentum up being so strong and the Emini at the top of the range, the odds are that it will break out of the top before it breaks out of the bottom. However, it is overbought and stalling, and the odds also favor a sideways to down pullback first.
The rally has been so strong on the weekly chart that the first pullback will probably be bought. This means that if the Emini falls below last week’s low, or if next week falls below this week’s low, the selloff will probably be bought. The bears will probably need at least a micro double top if they are to get their big double top with the all-time high.
If the Emini does pullback for a couple of legs and a couple weeks, the bulls will see the pullback as a high 2 (ABC) bull flag. They will buy the pullback. We do not know if they will take profits just below the all-time high and create a double top, or if they will keep buying, and buy even more aggressively above the old high. Also, we do not know how many bear dollars are on the sidelines, waiting for the momentum to slow or for the Emini to get a little closer to the high. We should find out over the next few weeks.
Forex: Best trading strategies
The daily chart of the EURUSD got within 30 pips of the 6 month trading range low. This is the 3rd test down in the trading range. The prior two selloffs to this level were followed by a 500 pip rally. While it is no evidence that it will do that again, it is at major support, the daily chart has had 3 pushes down over the past couple of weeks, and all three were in the form of buy climaxes. These factors make a bounce likely for the next couple of weeks, whether or not the EURUSD falls slightly below the 6 month low.
The bears see last night’s rally as another bear flag. The bulls see it as the start of a reversal up from the bottom of a 3 week 60 minute bear wedge. The rally was reasonably strong on the 5 minute chart, but minor on the 60 minute chart. The bulls need a much strong bull breakout before traders are confident that a 200 pip rally to the October 28 top of the wedge bear channel has begun. The location and pattern support a rally, but the bulls need either a better looking 60 minute candlestick pattern, or a strong bull breakout above the wedge bear channel before traders will be confident that the selling has ended.
Summary of today’s S&P Emini futures price action and what to expect tomorrow
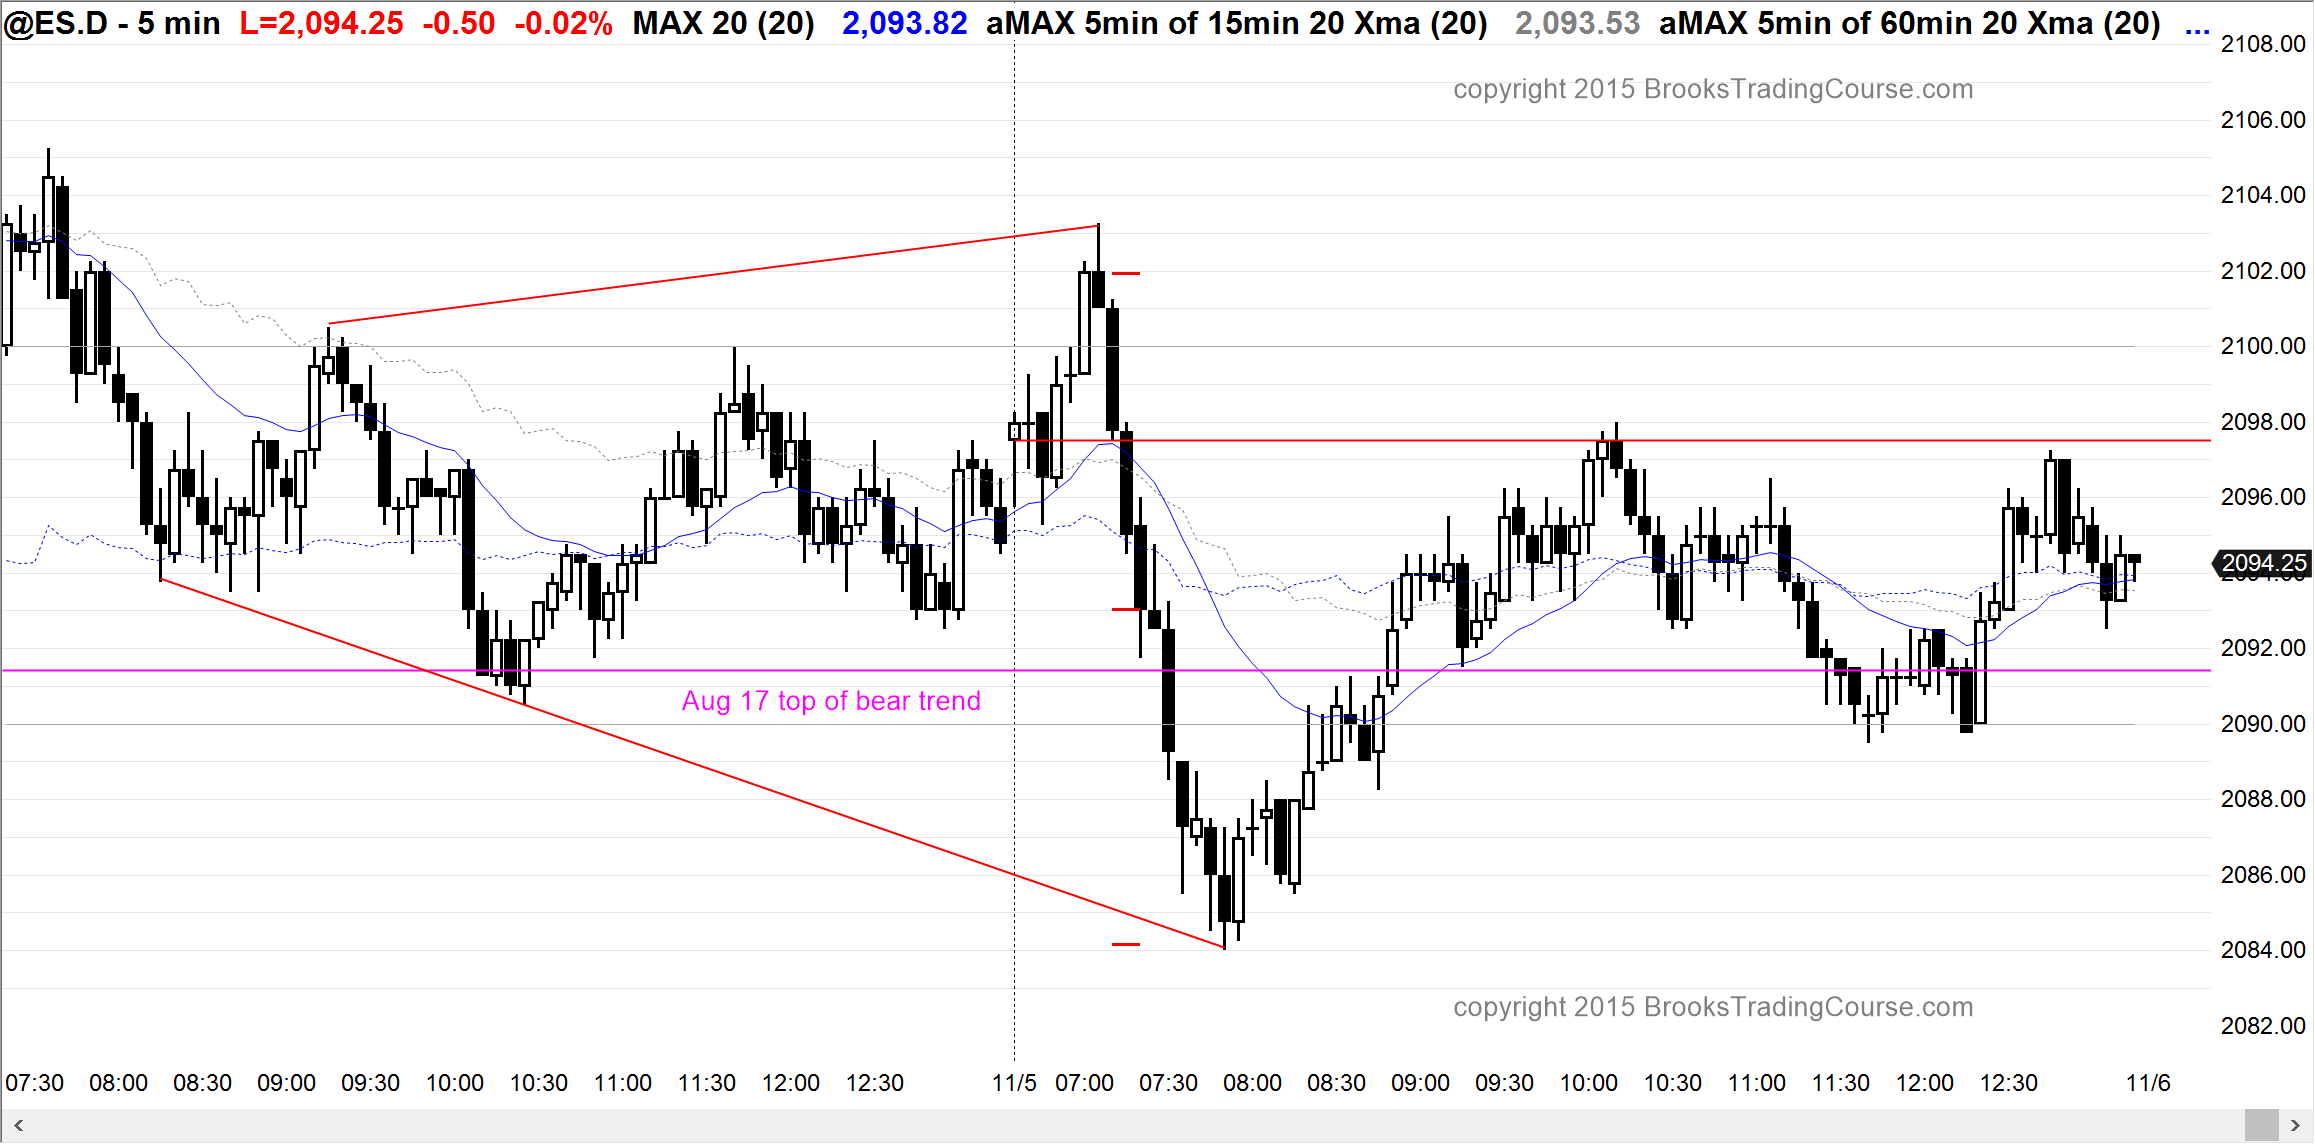
The Emini sold off from a lower high after yesterday’s 60 minute nested wedge top. It reversed up from an expanding triangle bull flag and spent most of the day in the middle of the range. It is neutral going into tomorrow’s report. Tomorrow could gap down because the Emini is overbought and at the top of the range. It could gap up above the all-time high. Since the Emini is stalling above the August 17 top of the bear trend and below the all-time high and this is trading range price action, the odds are that it will begin to go sideways for a couple of weeks. Regardless of the report, traders will more likely sell to take profits or sell for a trade down rather than buy.
Tomorrow is Friday and traders will look for weekly magnets, especially late in the day. After 5 consecutive bull bars on the weekly chart, the Emini might create a bear bar, which means a possible close below Monday’s open of 2077.00.
Original post was published at Al Brooks Price Action Trading Blog. Check Brooks Trading Course and get The most comprehensive source of information on price action trading available!


 Review")


