Monthly S&P500 Emini futures candlestick chart: Middle of trading range
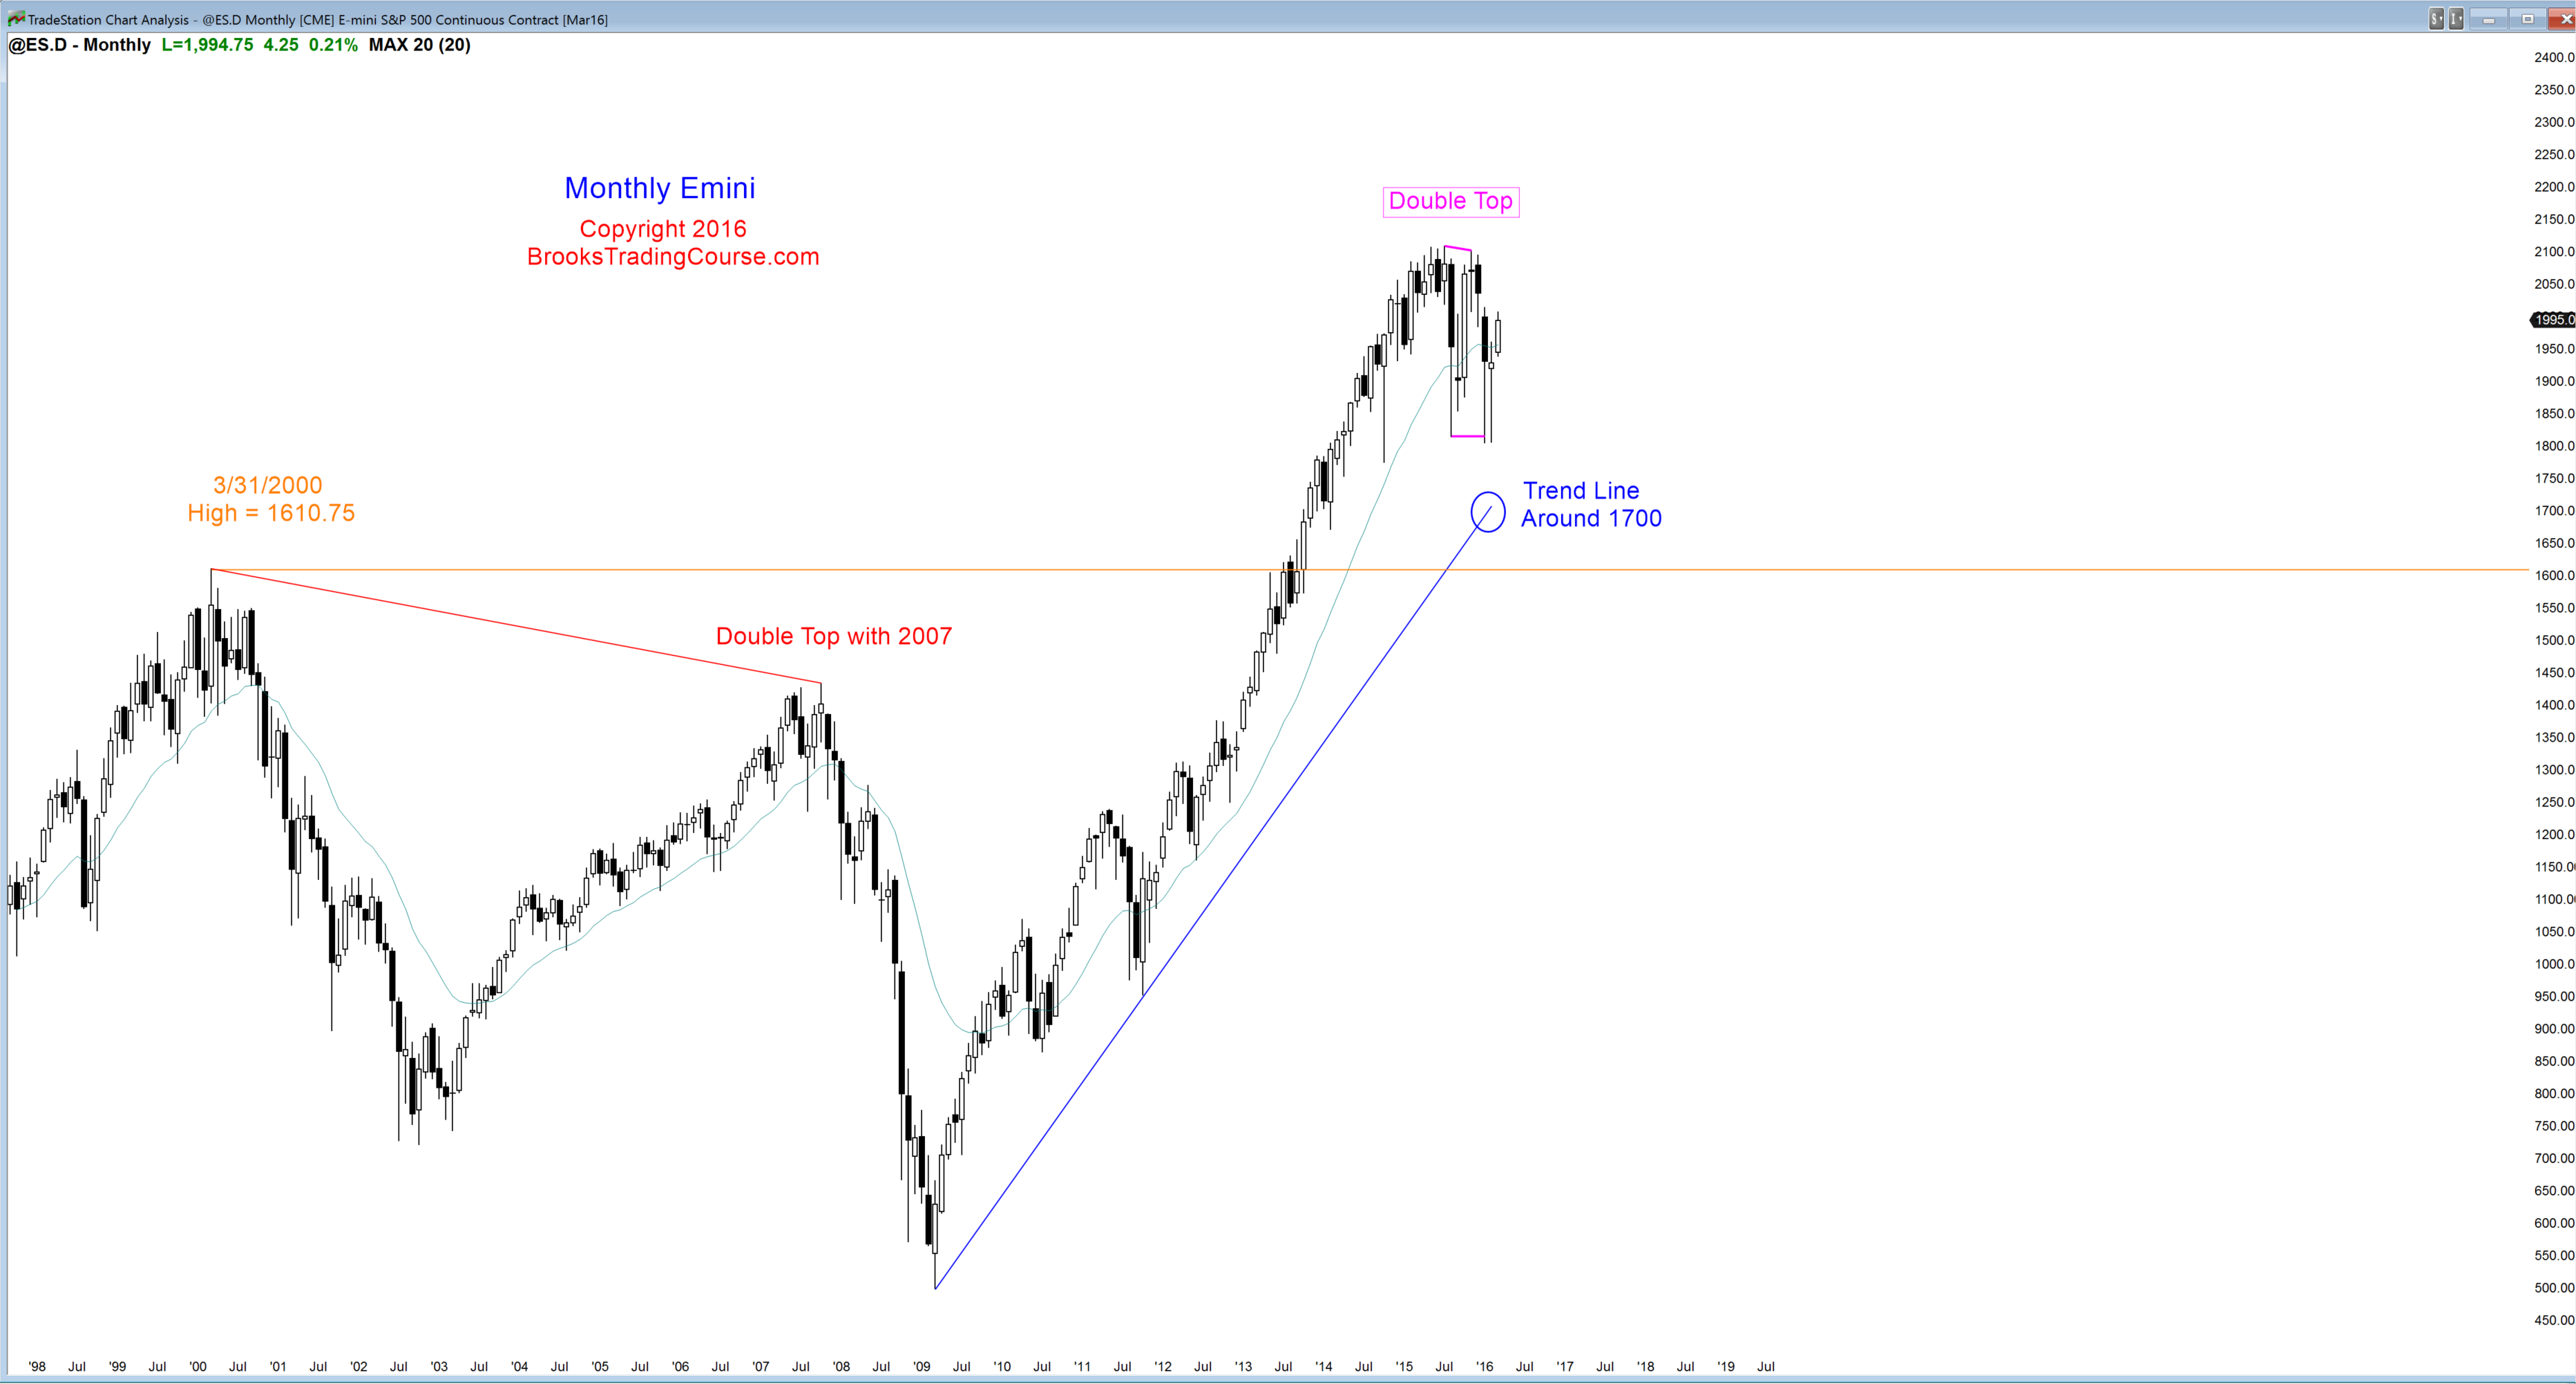
The monthly Emini chart is still recovering from a buy climax. It held above the 20 month EMA for 38 months, which has happened only twice in the cash index in the past 50 years. The two prior times were followed by 36% and 22% corrections. The current correction has only been 14%. Also, the breakout above the double top around 1600 has never been tested. The buy climax is the kind of environment that could lead to a breakout test. However, the Emini is still within its trading range. Because of the extreme buy climax, the odds are still about 55% that the Emini breaks below the bottom of the trading range before it breaks above the top. There is also a 30% chance that the selloff will reach the March 2000 high, just above 1600.
Weekly S&P500 Emini futures candlestick chart: Reversing the January selloff, but still a possible nested head and shoulders top
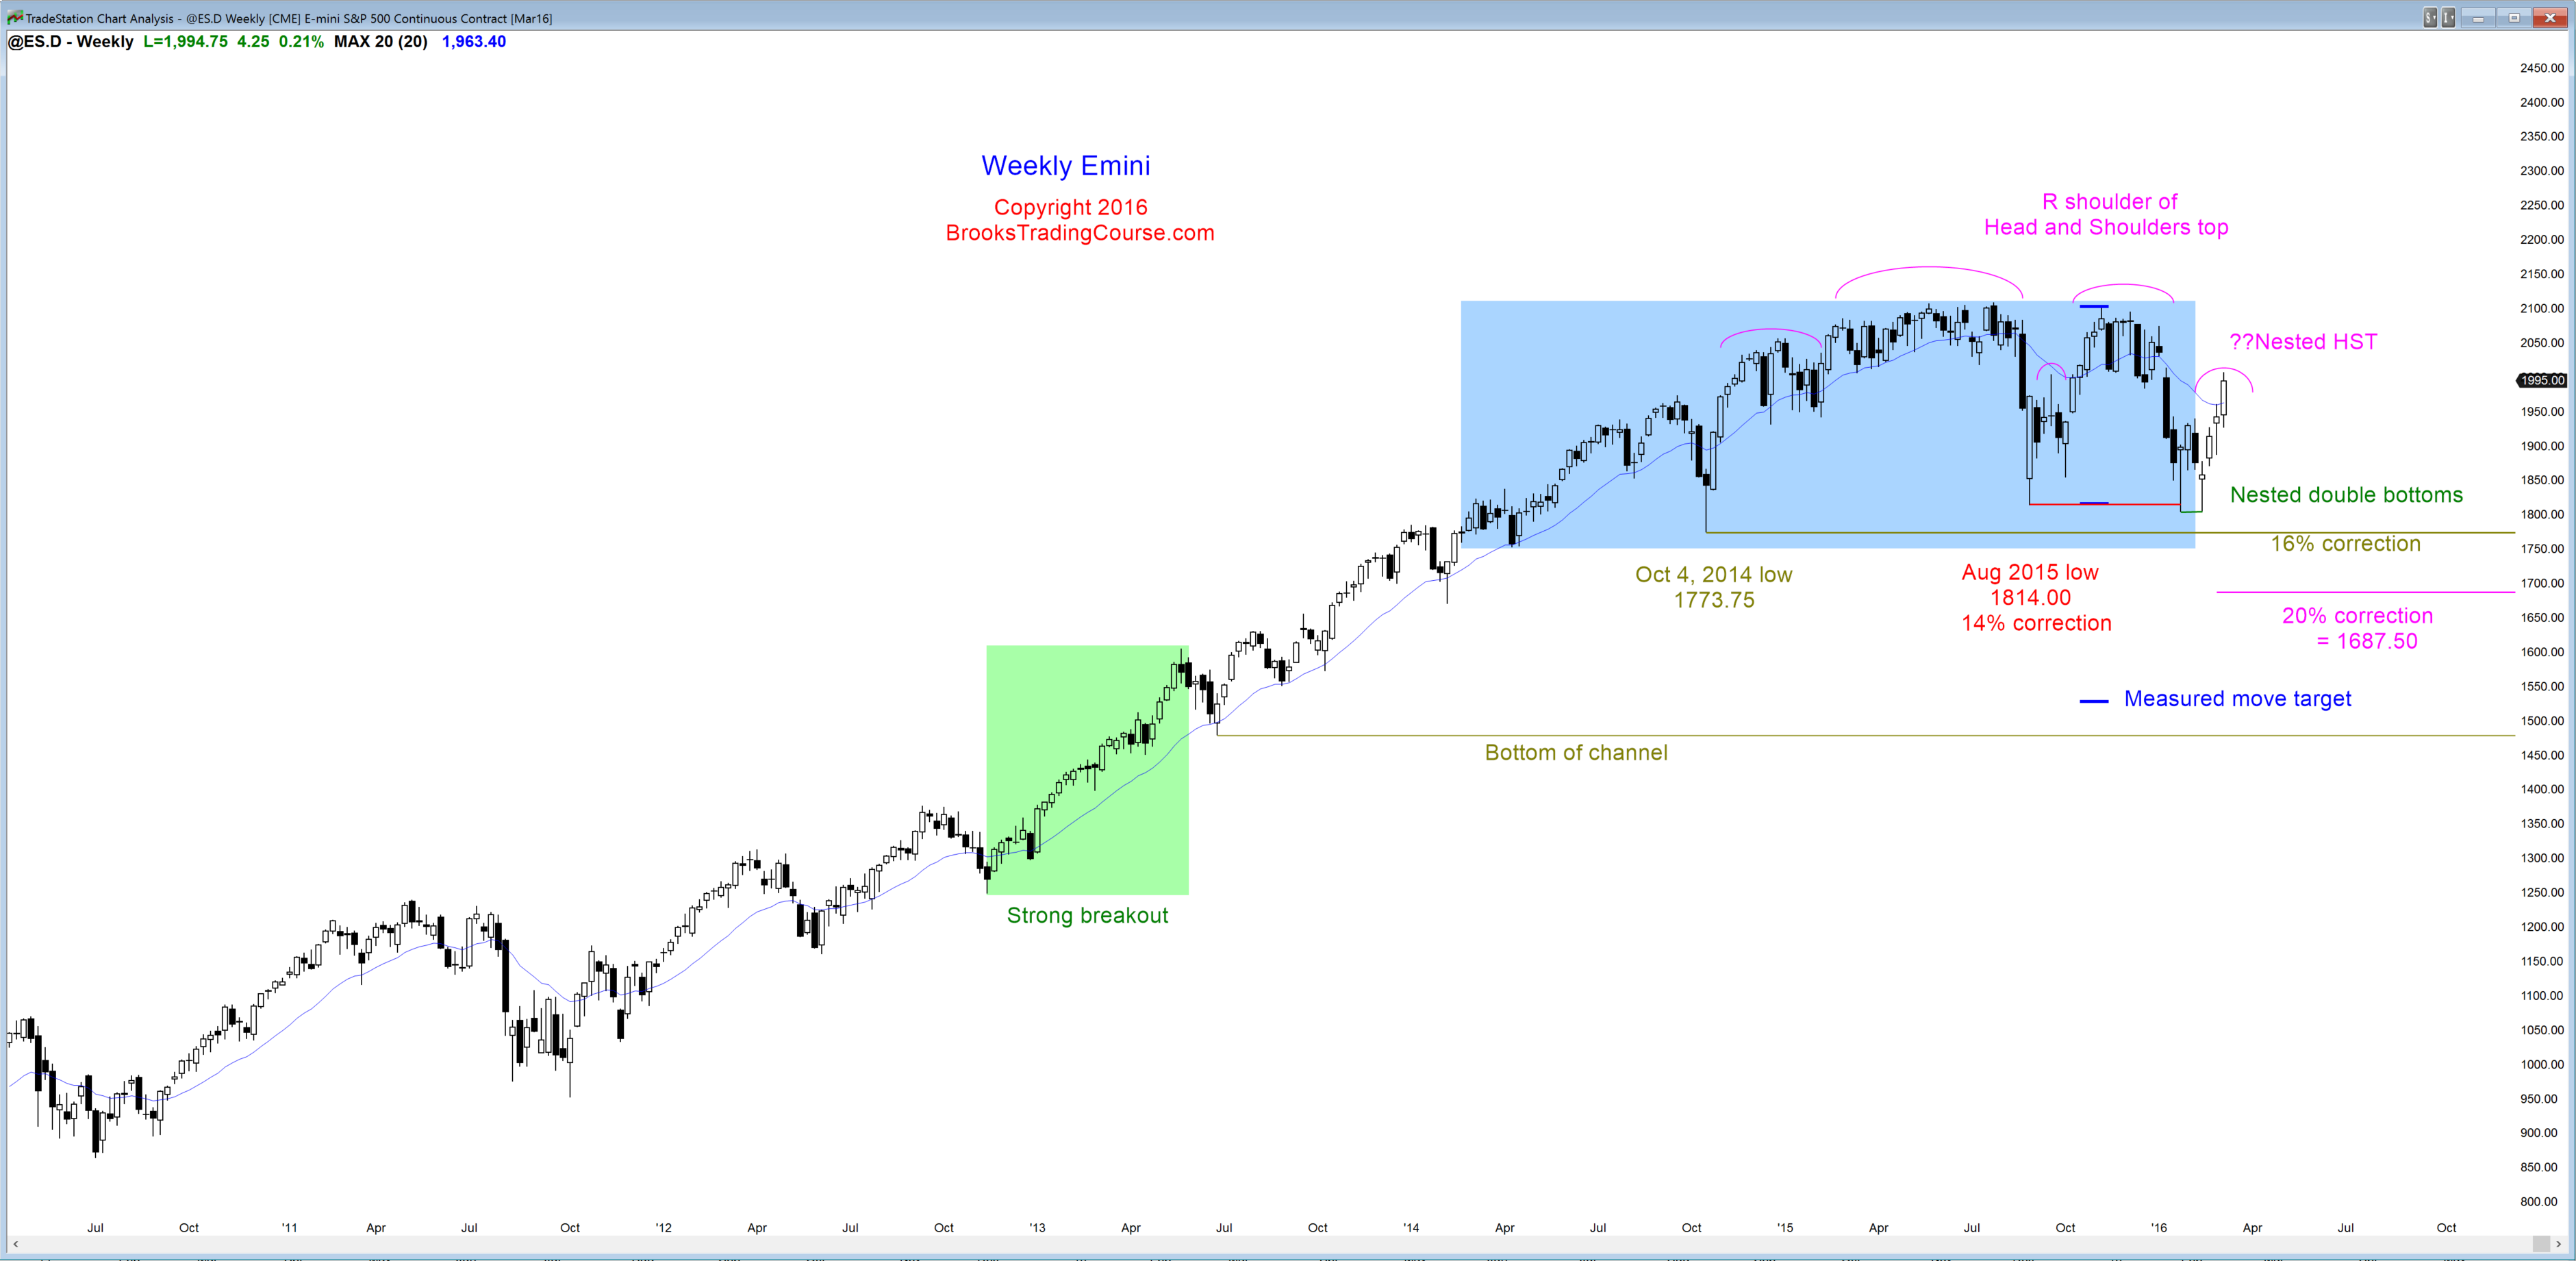
The weekly char had a big bull trend bar this week, which might simply be a buy vacuum test of the top of the January sell climax. There is a small chance that Monday will gap up and create an island bottom with the January gap down. However, island tops and bottoms in trading ranges are meaningless since there is an 80% chance that any breakout attempt within a trading range will fail. If the current rally fails, it will form a nested head and shoulders top.
A nested pattern is one where the 3rd part subdivides into a smaller version of the same pattern. Here, the right shoulder of the 2 year pattern subdivides into a smaller head and shoulders top. Nested patterns have a higher chance of success, but most tops are trading ranges and only have about a 40% chance of a swing down. It is more likely that the trading range continues to grow and form other top and bottom patterns. Eventually, there is a successful breakout. There is no sign of one yet, and the current rally is just another strong move within the range. The rally has reached the top half of the range, and bulls will begin to take profits and bears will start looking for sell setups.
Daily S&P500 Emini futures candlestick chart: Learn how to trade a Low 4 sell climax candlestick pattern
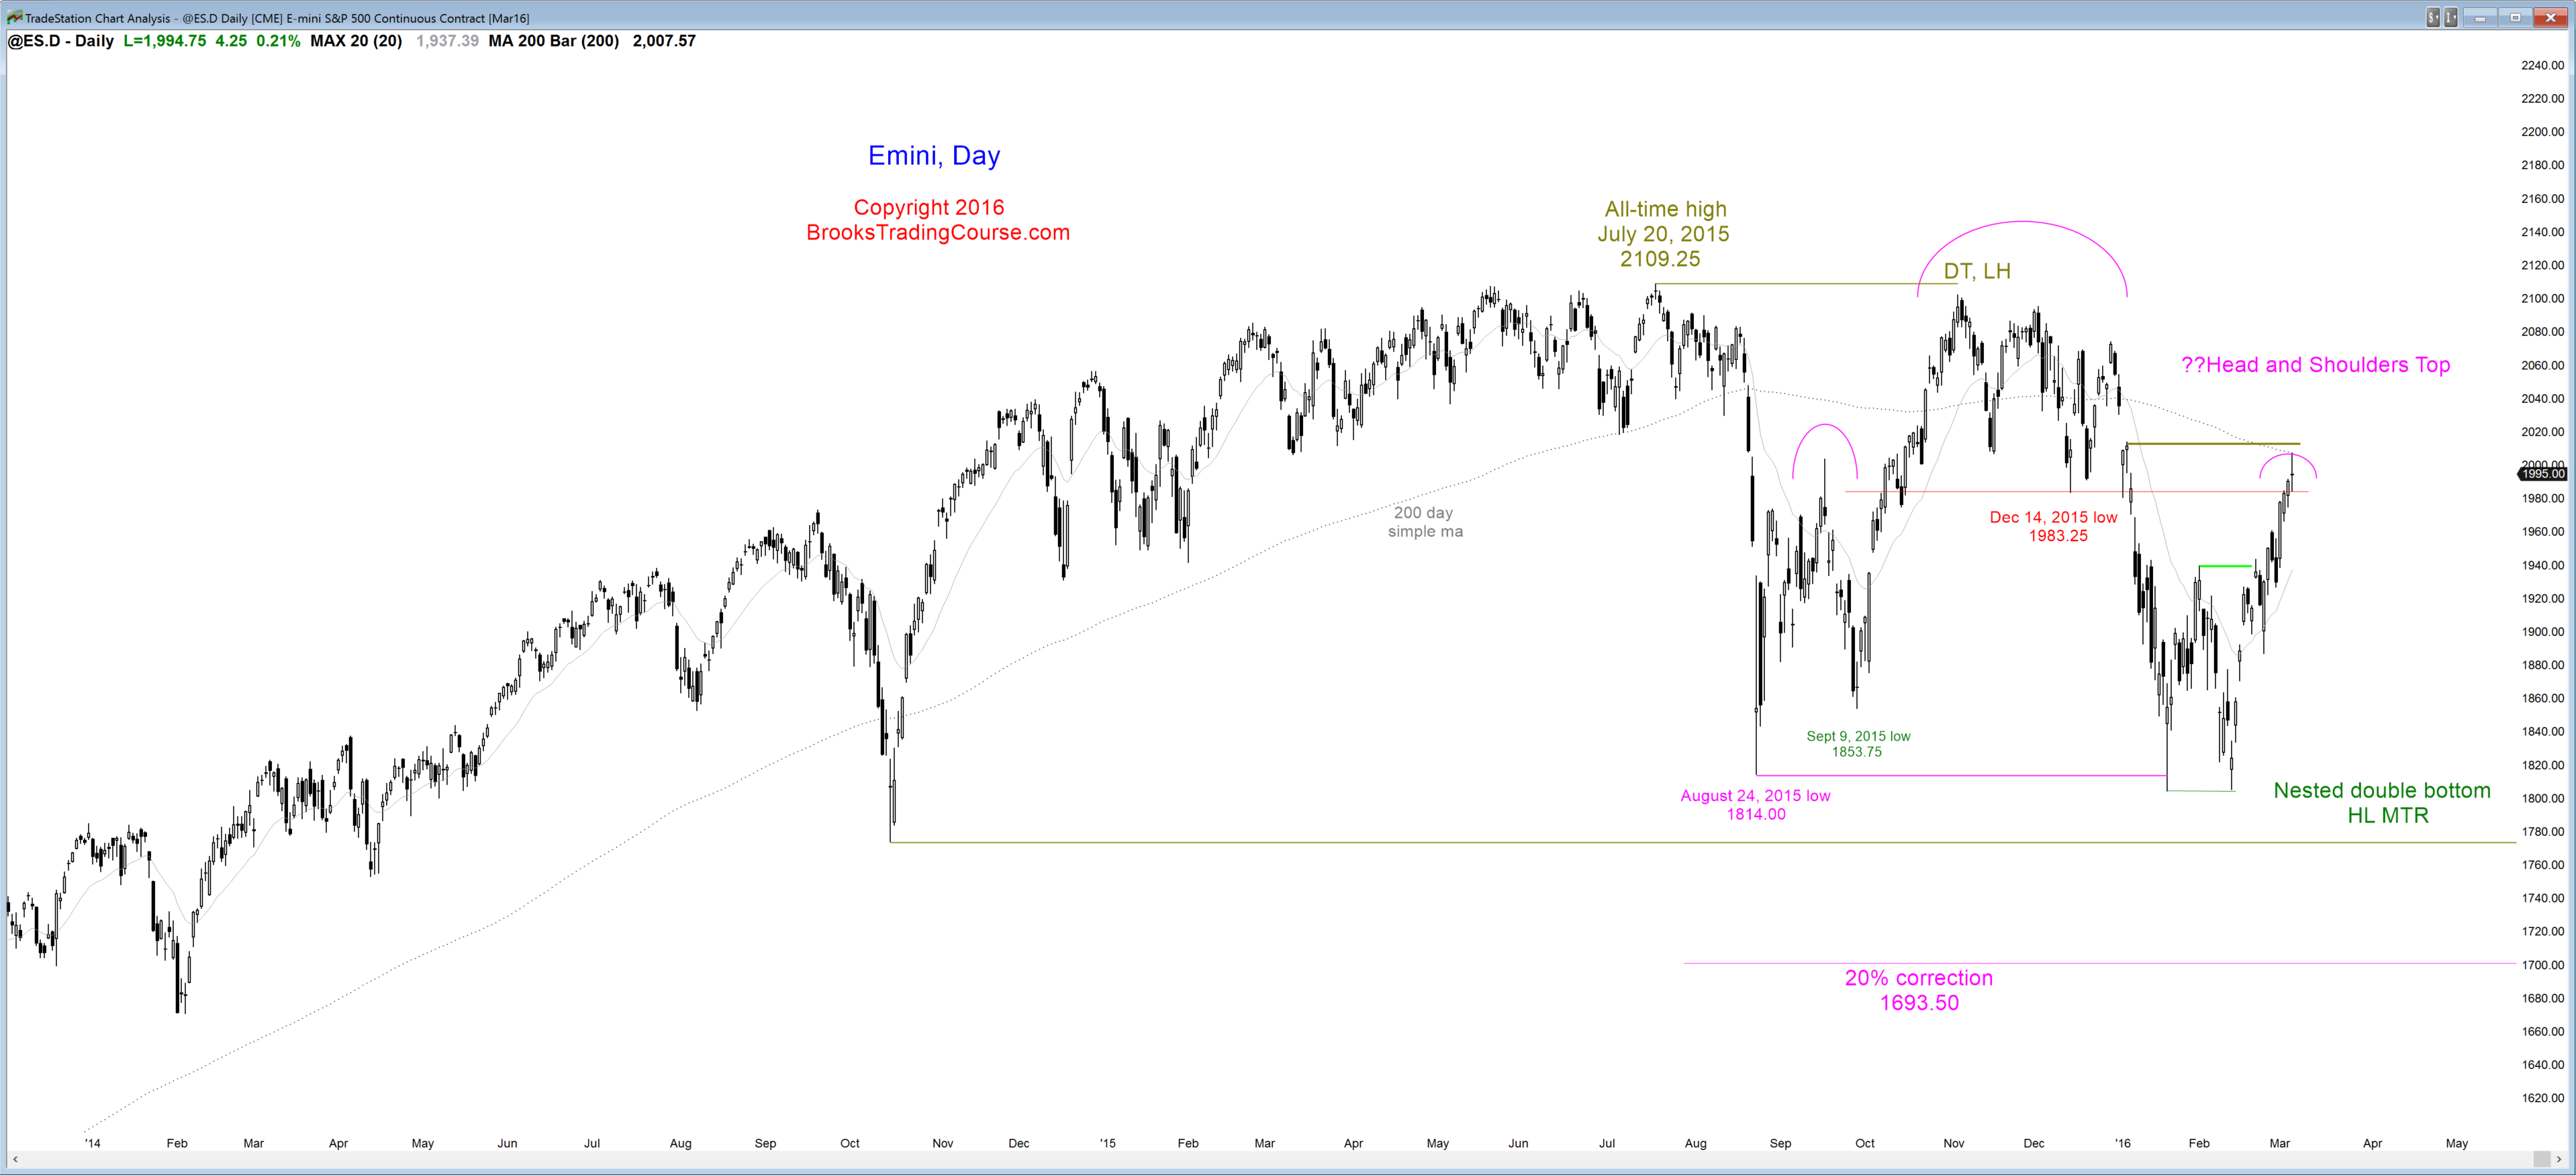
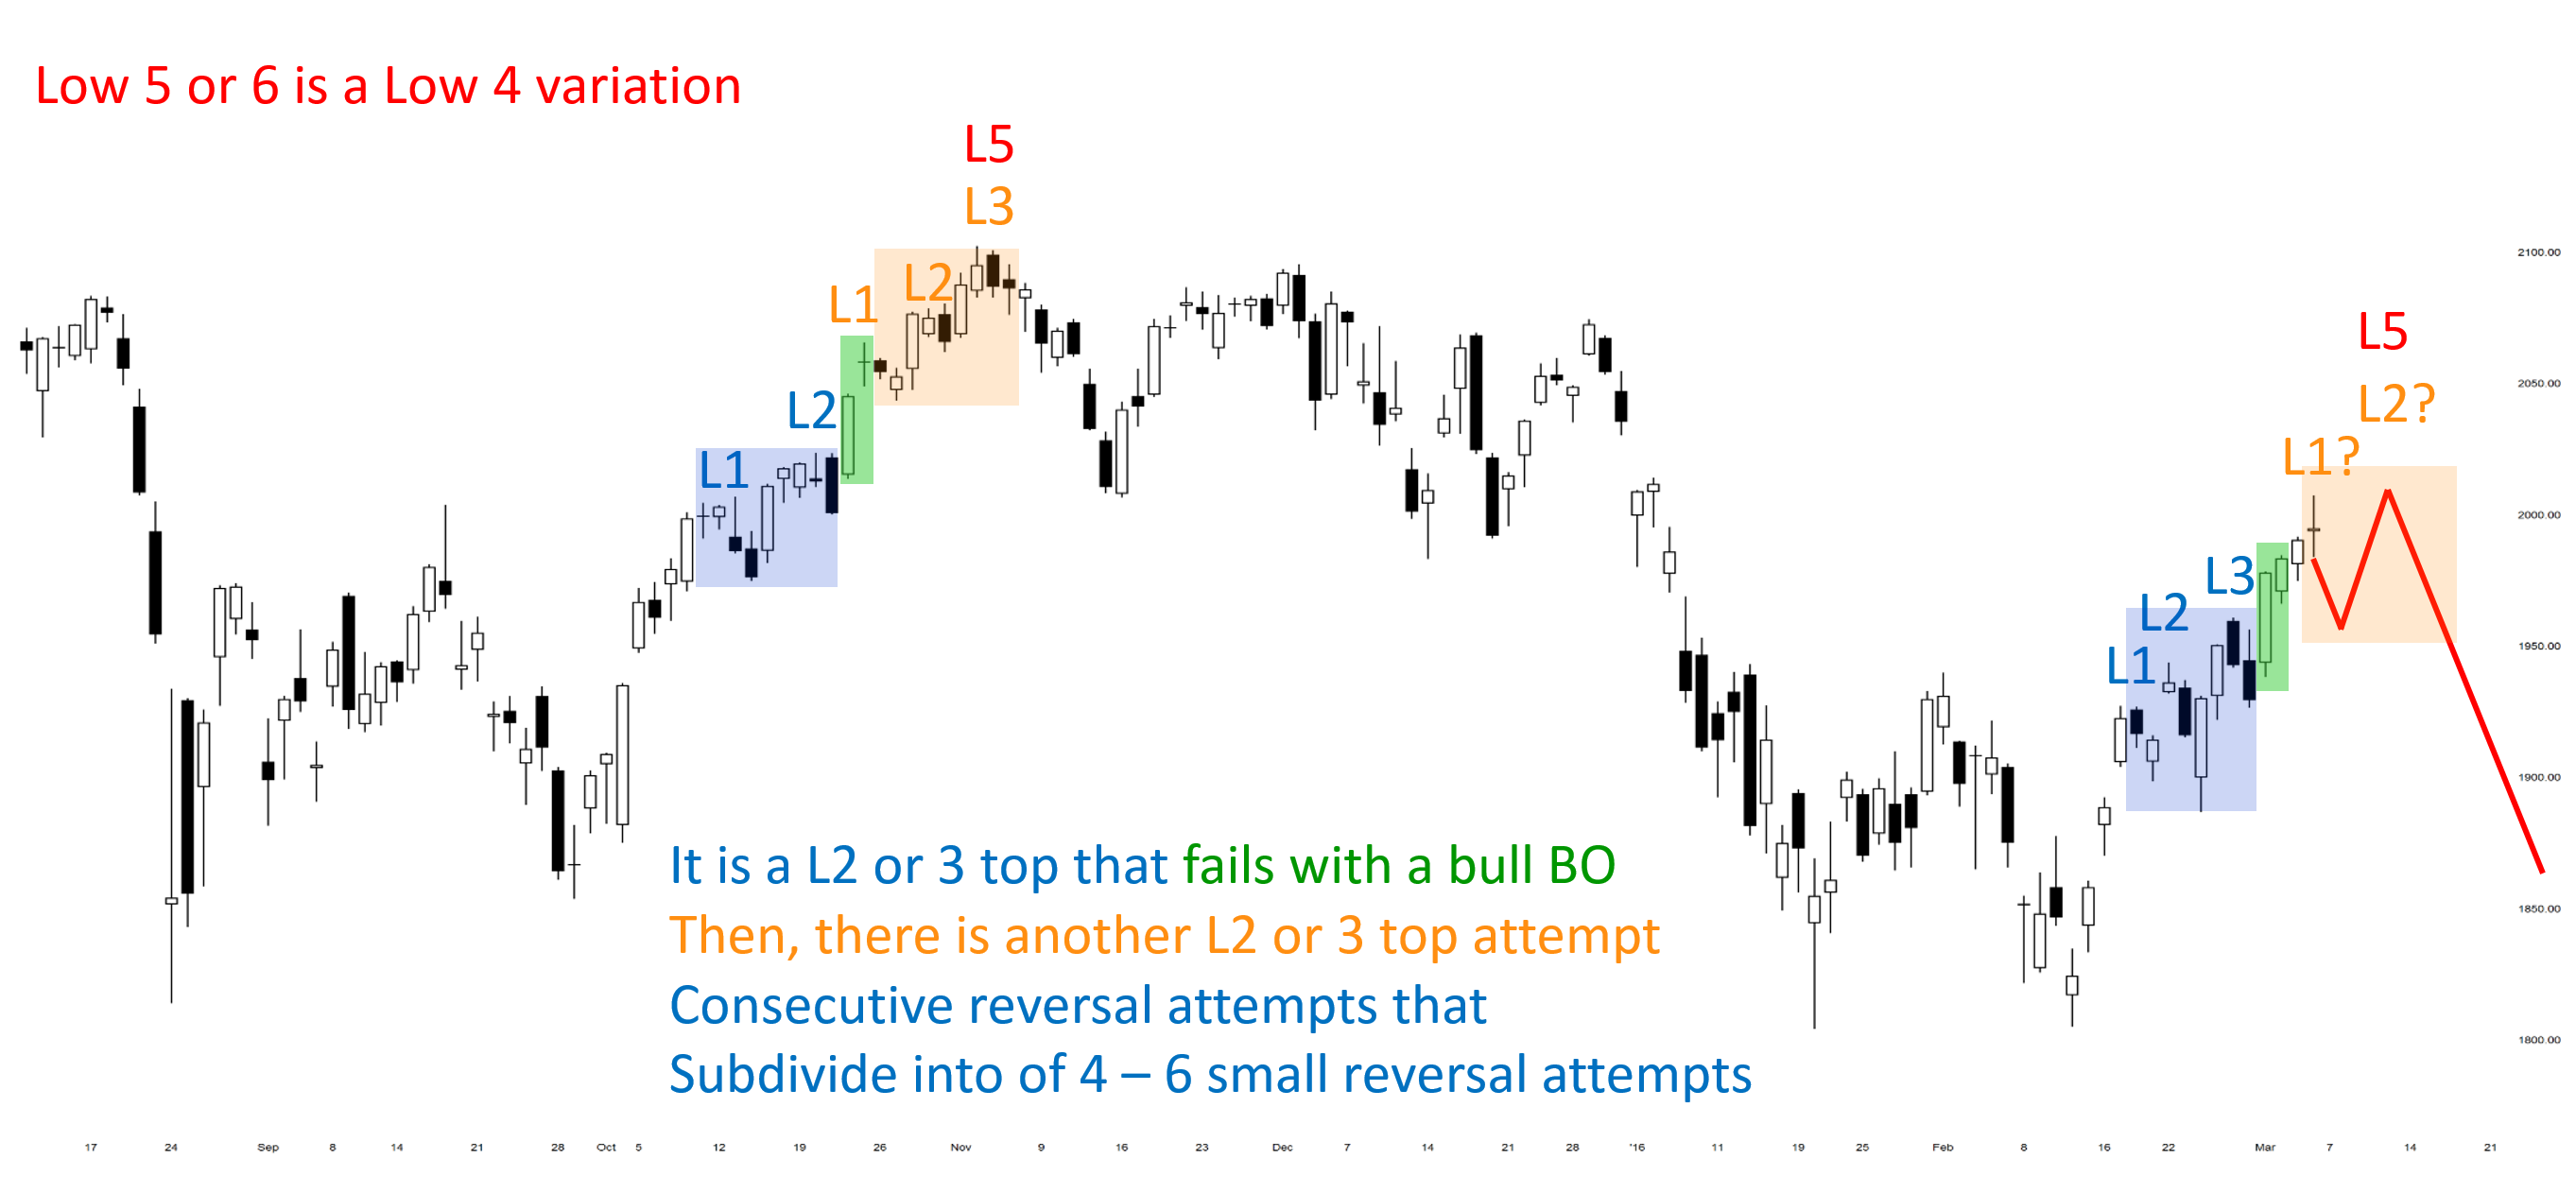
The daily chart is currently the most interesting because of a potential Low 4 sell setup. The October rally failed with a Low 4 top. A Low 4 top is made of a top that fails, and it is followed by a 2nd top. Each top has 2 or 3 legs up within in. I coined the term “Low 4” because the simplest version is a Low 2 top, followed by a bull breakout above the top, and then a 2nd Low 2 top. However, either or both of the tops can be a wedge top instead of a Low 2 top, and therefore a Low 4 can actually be a Low 5 or Low 6. They are all variations of the same price action.
In October, the Low 2 top triggered, and it was immediately followed by a strong bull breakout above the top. A strong breakout usually has at least 2 legs up. That breakout had 3 legs up, creating a wedge top. The Low 2 and then the Low 3 adds up to a Low 5, but a Low 5 is just a variation of a Low 4. That October Low 4 was followed by a 10% correction.
The Emini had an expanding triangle top 2 weeks ago that triggered when Monday traded below the February 26 low. This was followed by a very strong 4 day bull breakout above that top. Since this week’s bull breakout was strong, the 1st reversal down will probably be bought. If Monday trades below Friday’s low, that would make Friday a Low 1 sell signal bar. Since there is a 70% chance that there will be buyers below Friday’s low and then at least one more leg up, there is a potential Low 4 sell signal coming within the next couple of weeks.
For example, if there is a 1 – 3 day pullback next week below Friday’s low, and then one more push up to above Friday’s high, and then another reversal down, that reversal down with be a Low 2 sell entry. Since this Low 2 would be following the Expanding Triangle Low 3, the entire pattern would be a Low 5 top, which is a variation of a Low 4 sell setup.
If this happens, it would have about a 70% chance of a TBTL Ten Bar, Two Leg correction for its minimum goal. It would also create a head in a potential nested head and shoulder top.
There are other topping patterns as well, and I will write about them if they become more likely than they are now. The important point is that the current rally is happening within a 2 year trading range, and the odds are that this rally will reverse down toward the bottom of the range.
Since the daily chart has been forming lower highs and lows since February and it is therefore in a broad bear channel. The odds of a bear breakout go up if there is a topping pattern as well. However, traders who trade the markets for a living know that until there is a breakout, there is no breakout. Traders learning how to trade the markets have to learn that strong rallies and strong selloffs are the building blocks of trading ranges, and they should look for trading range reversals and not breakouts.
Trading ranges contain both early bull and bear trends. Most of these trends fail, and the trading range then continues. It is more profitable to keep looking to sell near the top and buy near the bottom until there is a successful breakout.
See the weekly update for a discussion of the price action on the weekly candlestick chart and for what to expect going into next week.


 Review")


