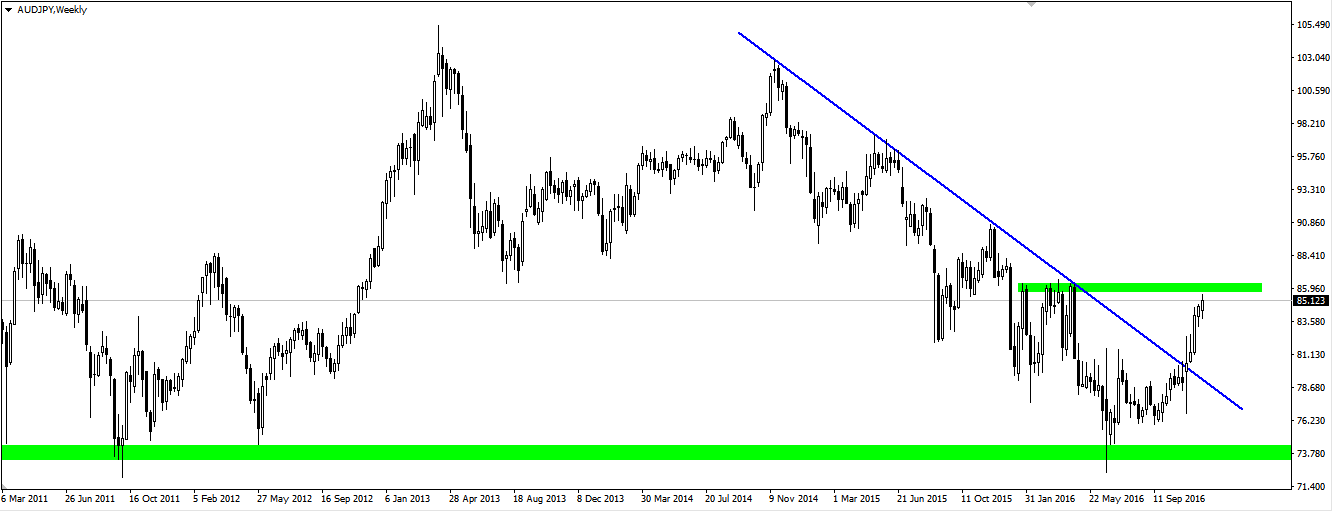
Very interestingly and technically in the longer term moves pair AUDJPY. On weekly chart, we have well respected line of the downtrend that was broken after almost 2 years. Currently, we have bullish move, which, however, is approaching a key resistance, which is set by a whole series of previous tops.
Check how may be preferred terms of trade with a broker XM
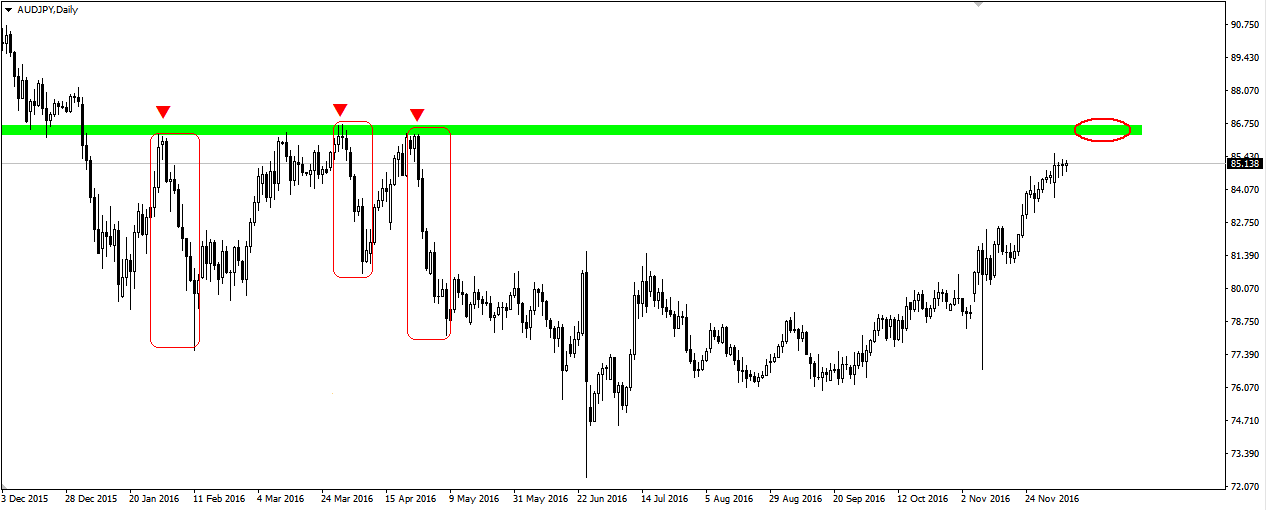
This is clearly visible on daily chart. It seems that the best thing we can do now is wait until the price reaches the resistance. This level is extremely thoroughly respected, and the last rebounds from it brought very dynamic downward moves. Despite breaking the trend line and its potential changes of trend in the broad outlook, it seems that at that resistance we can expect at least a strong correction. Increases last almost continuously from mid-September and correction in such a place would be something natural. Potentially interesting opportunity for transaction hangs in the air.


 Review")


