The currency pair GBPCHF on the H4 chart later yesterday moved in the formation of a right triangle. Breakout from the formation occured thru the bottom, in the direction of the current downtrend.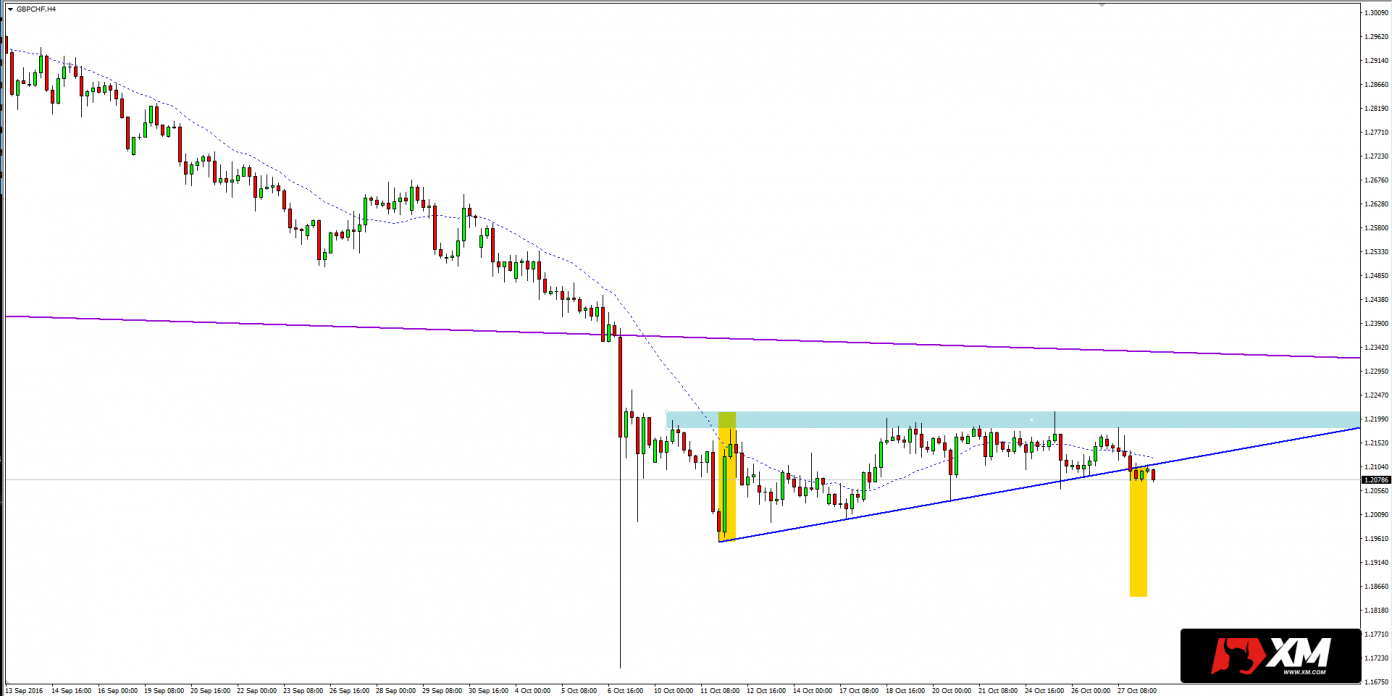 Moving to a lower interval chart (30 minutes), we see that the lower arm of the triangle that gave support, has already been twice tested as a new resistance (with a positive effect). Therefore,further declines are expected .The target for potential shorts can be measured by the movement which often occurs after breakingout, and which is the height of the triangle formation (golden rectangle on the chart H4, around the level of 1.8440).
The above analysis was carried out on the account from a broker XM, which offers $ 30 to start!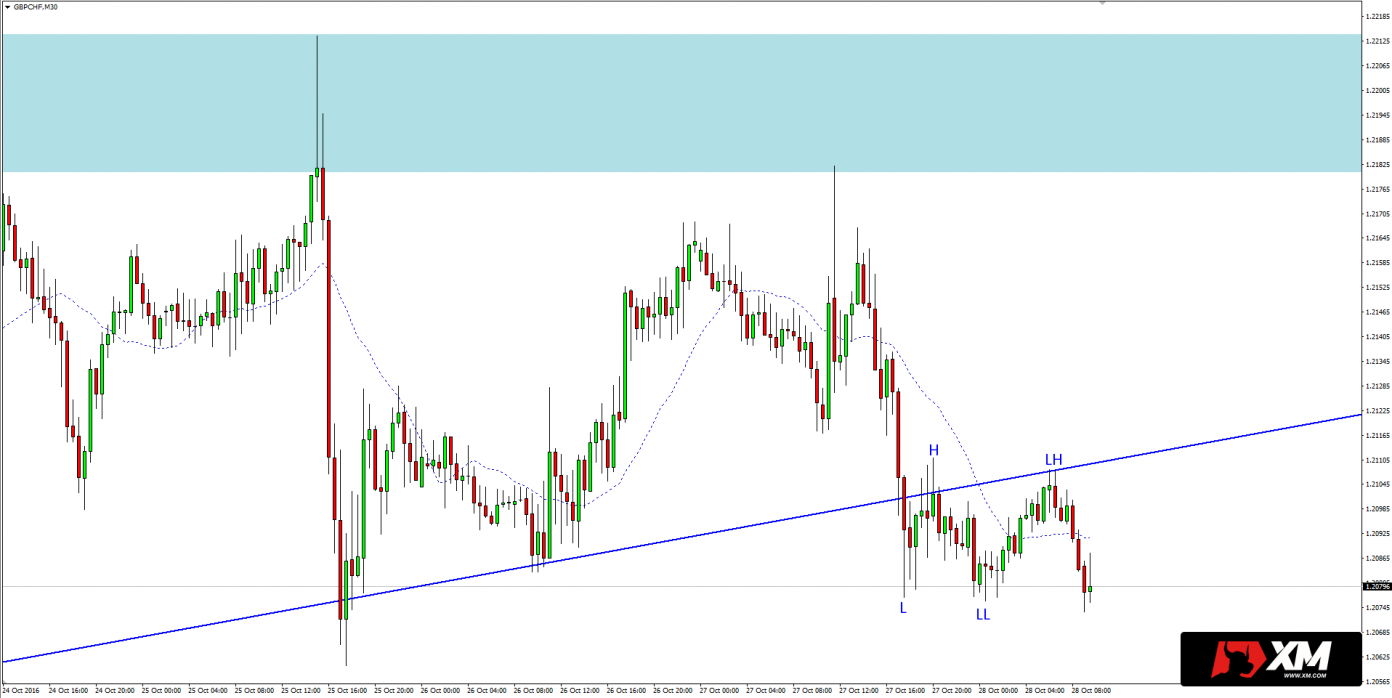


 Review")


