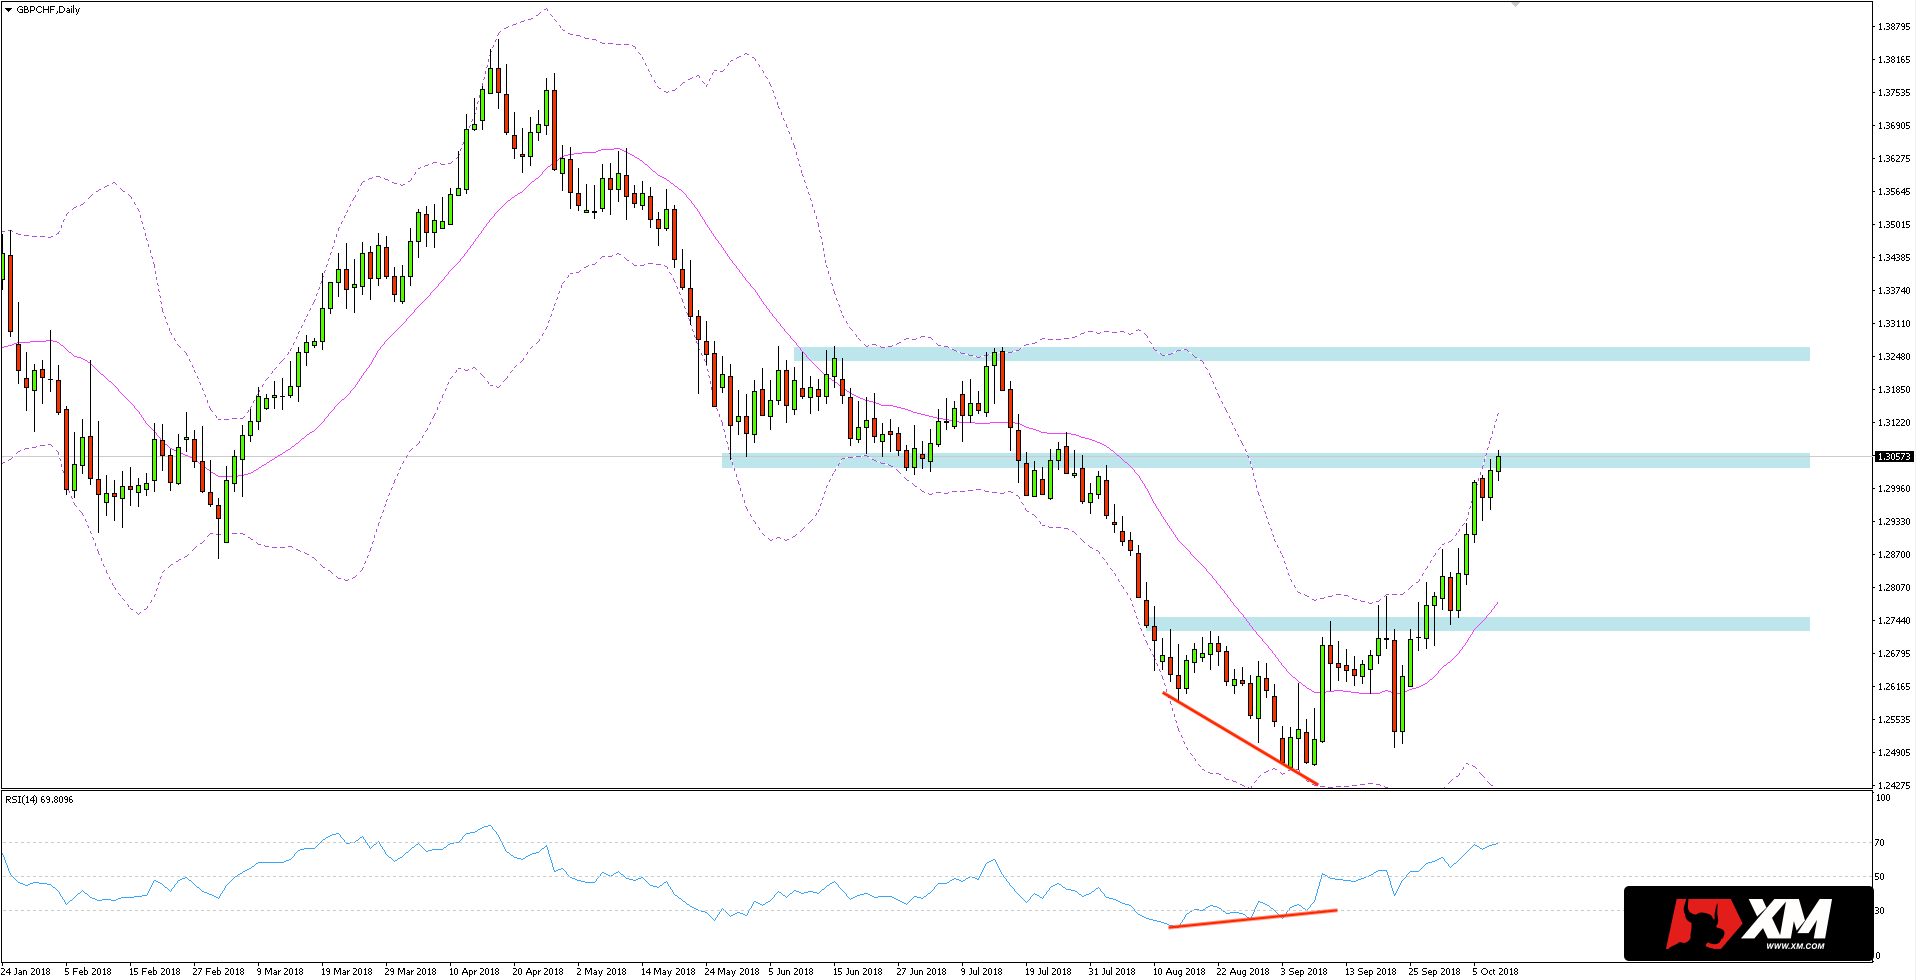
The GBPCHF strengthens this month and, as can be seen in the daily chart below, and move on the external Bollinger banner, which indicates a significant advantage of buyers. In addition, the strength of bulls is confirmed by the RSI indicator, which oscillates around the level of 70. The course has now reached the resistance close to 1.3050, which previously also acted as support in consolidation. At the moment, there are no signs of exhaustion among buyers, and therefore there is a chance to overcome this area.
I trade on this instrument at broker XM, which has in its offer more than 300 other assets >>
In this scenario, another significant resistance will be found 200-pips higher, at 1.3250. Alternatively, a reflection from the resistance close to 1.3050 can activate the correction, where the closest support (dynamic) is the middle Bollinger band, on the daily chart it is just a 20-day SMA. The area of horizontal support can be found within 1.2730.


 Review")


