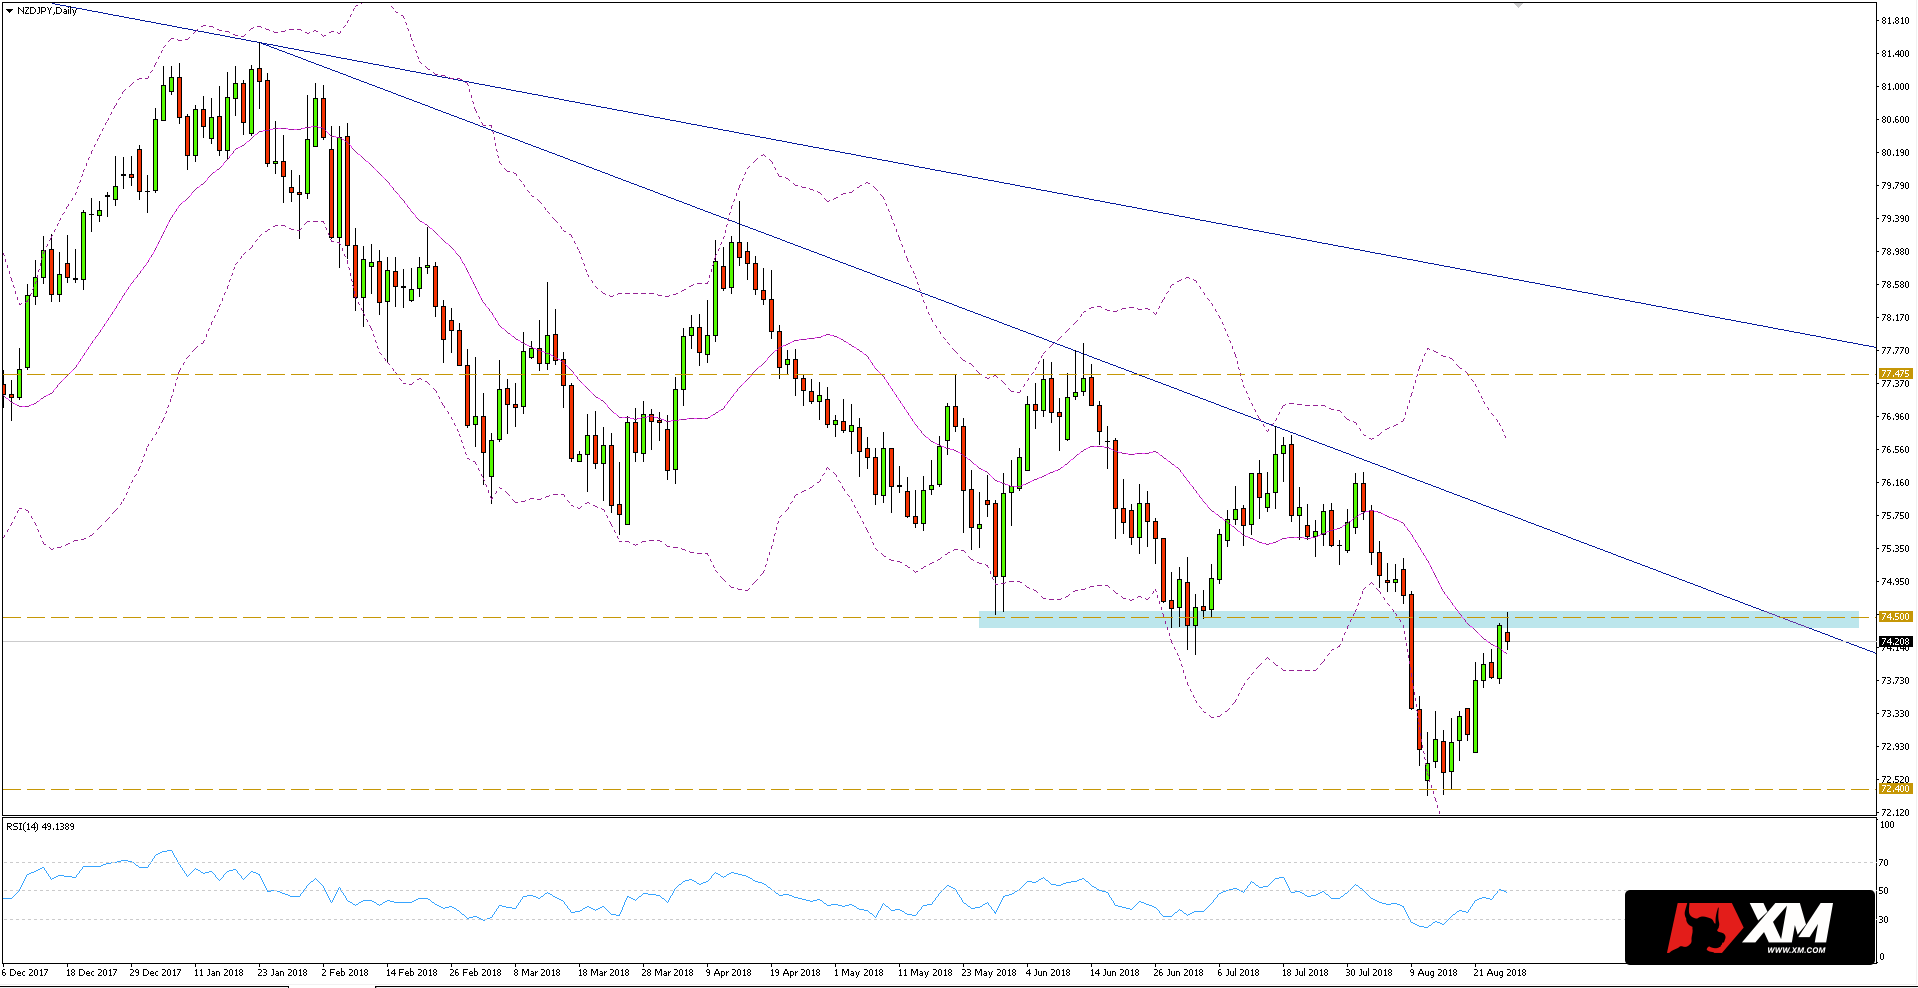
NZDJPY strongly declined in the first half of August this year, which resulted in breaking the support area within 74.50 and falling to the next defence area close to 72.40.
As can be seen in the daily chart below, after rebound from support at 72.40, the quotes returned to the area at 74.50, whose role has changed in to resistance. A lot now depends on the test of this level.
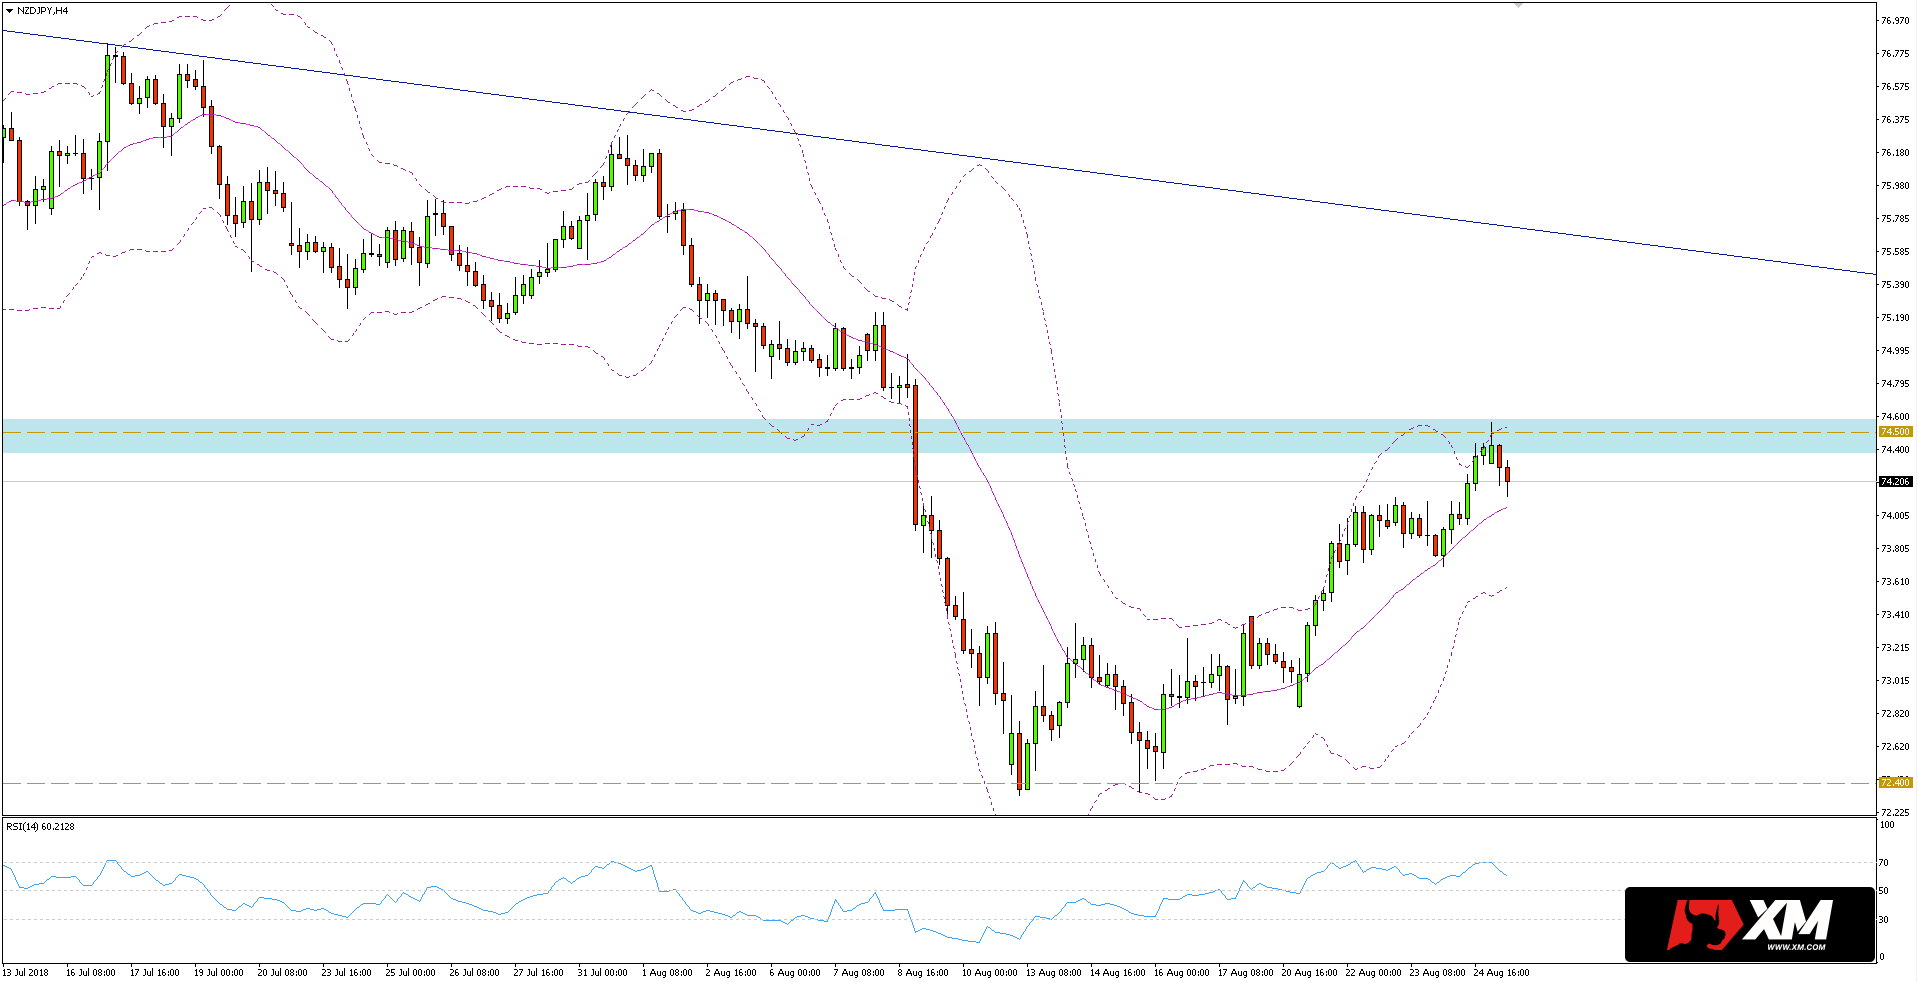
 After switching to the H4 chart, we see that the quotations are in the correction move between the middle and the outer Bollinger band, which indicates the advantage of the demand side. The discrepancy between the price that created the higher peak today may be a warning signal, but this was not done on the RSI indicator.
If the quotes can not overcome the resistance at 74.50, and in addition the course will be closed under the central Bollinger band, it may turn out that the southern direction will again be chosen, to the area of the last lows at 72.40.


 Review")


