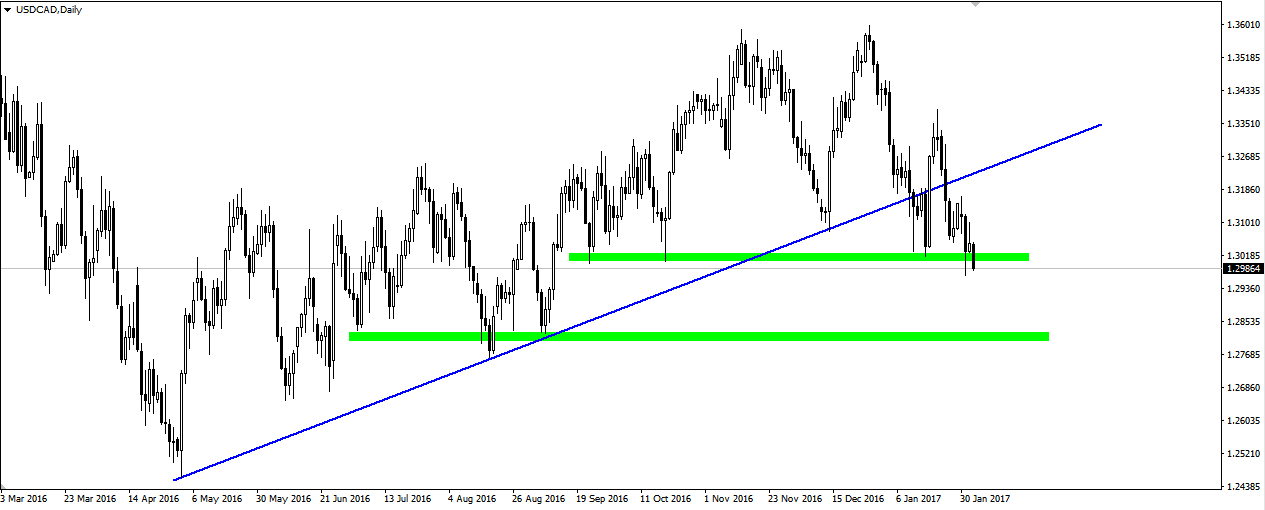
Observing chart H4 USD/CAD, we see that the price descends to lower and lower levels. Recently broke support, where the price reacted several times. It seems that the last resort before larger drops is a minimum of the last day of January, which probably is the closest target.

On daily chart, it seems that further declines are rather inevitable. Support area, you can drag far to the left. Previously was broken trend line and the overall picture suggests a continuation of declines. Strong breaking last mentioned in the previous graph should result in falls to the next support zone in the region of 1.2820.


 Review")


