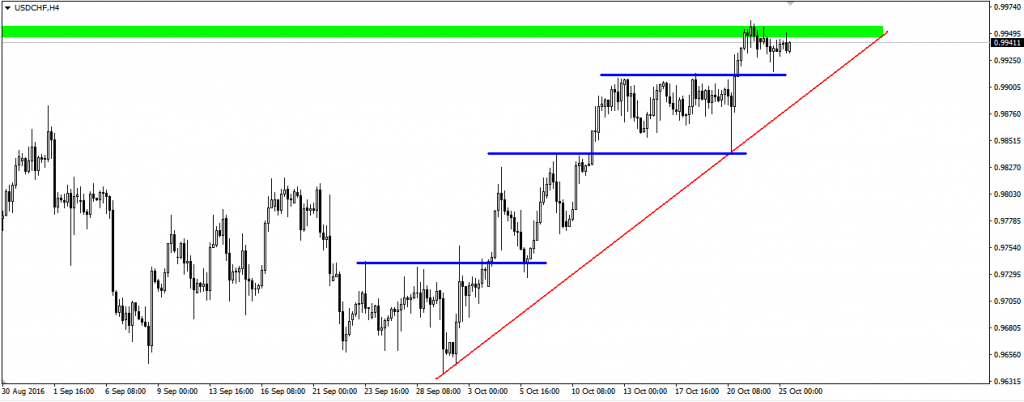
USDCHF moved lately in an extremely dynamic way. On the daily chart you can see how during this month, the price rapidly approached the key resistance level of 0.9950 of previous peaks. It seems that we can expect breaking it, and if it happens, it will open the way to the level of 1.0090 which is the high of early March.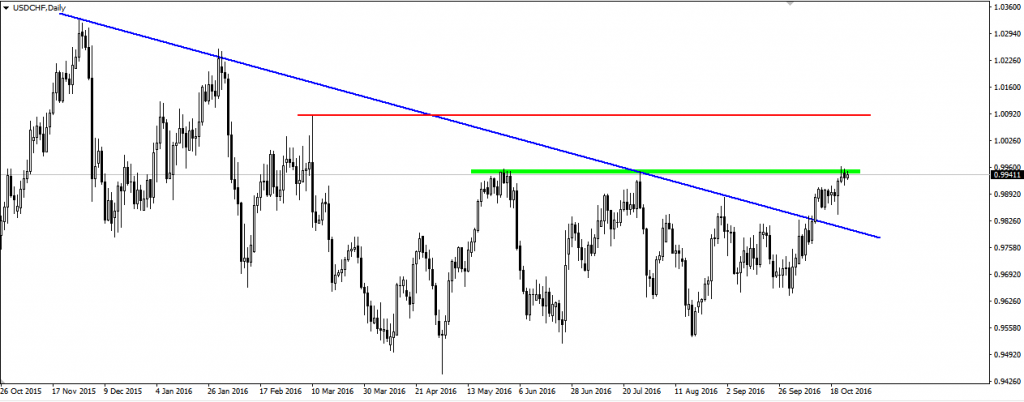 At the H4 chart we don’t see big activity from the bears despite price meeting such an important resistance level. This gives opportunity for bullish breakout, especially that the price rapidly is climbing to the top and the trend line is almost vertically inclined. Some indication may be that the price is respecting support levels resulting from previous highs. Above all conspicous is weakness of the correction, therefore we can expect breakout and if it occurs we should be prepared for such a scenario.
Try out XM account and get free $30 bonus without any deposit


 Review")


