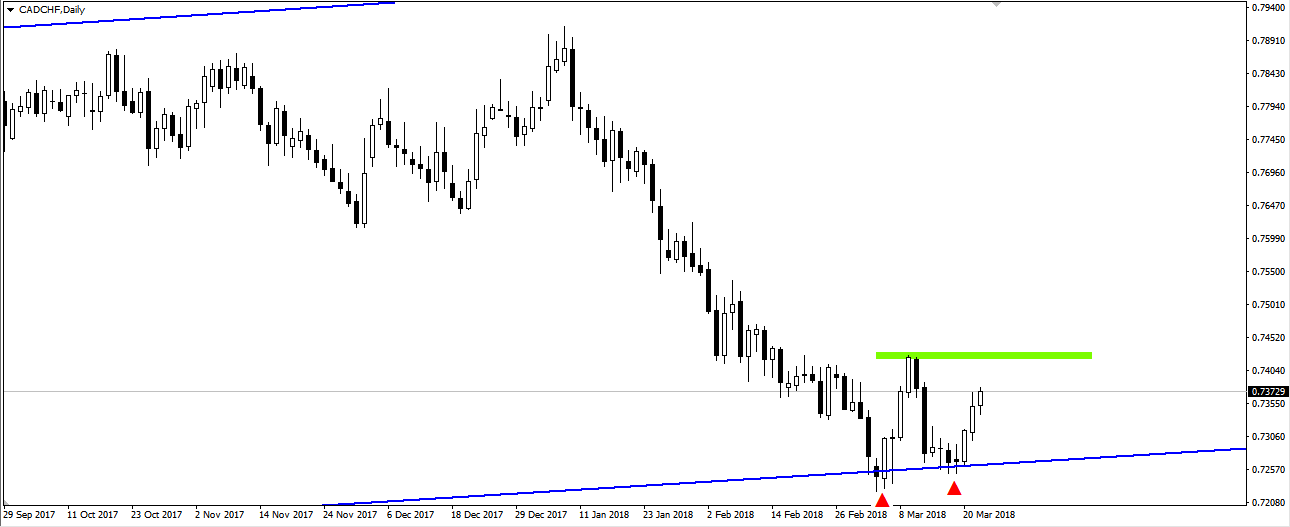
Recently,we can observe strengthening of Canadian currency. The depreciation of the Swiss franc has been evident for a long time. The quotes of this currency pair is beginning to look interestingly. The daily graph chart points on probable double bottom. The price rises to the level of the previous high, and its breaking would mean activation of this formation.
 Even more interesting is when we look at the weekly interval. Here you can see that the ranges of both downward and upward trends have similar ranges in recent years. Currently, after considerable drops, the price oscillates at the bottom edge of the channel. This is a potentially good place for reflection. Activation of the mentioned double bottom formation in this region may mean more bullish movement.
I trade on this instrument at broker XM, which has in its offer more than 300 other assets >>


 Review")


