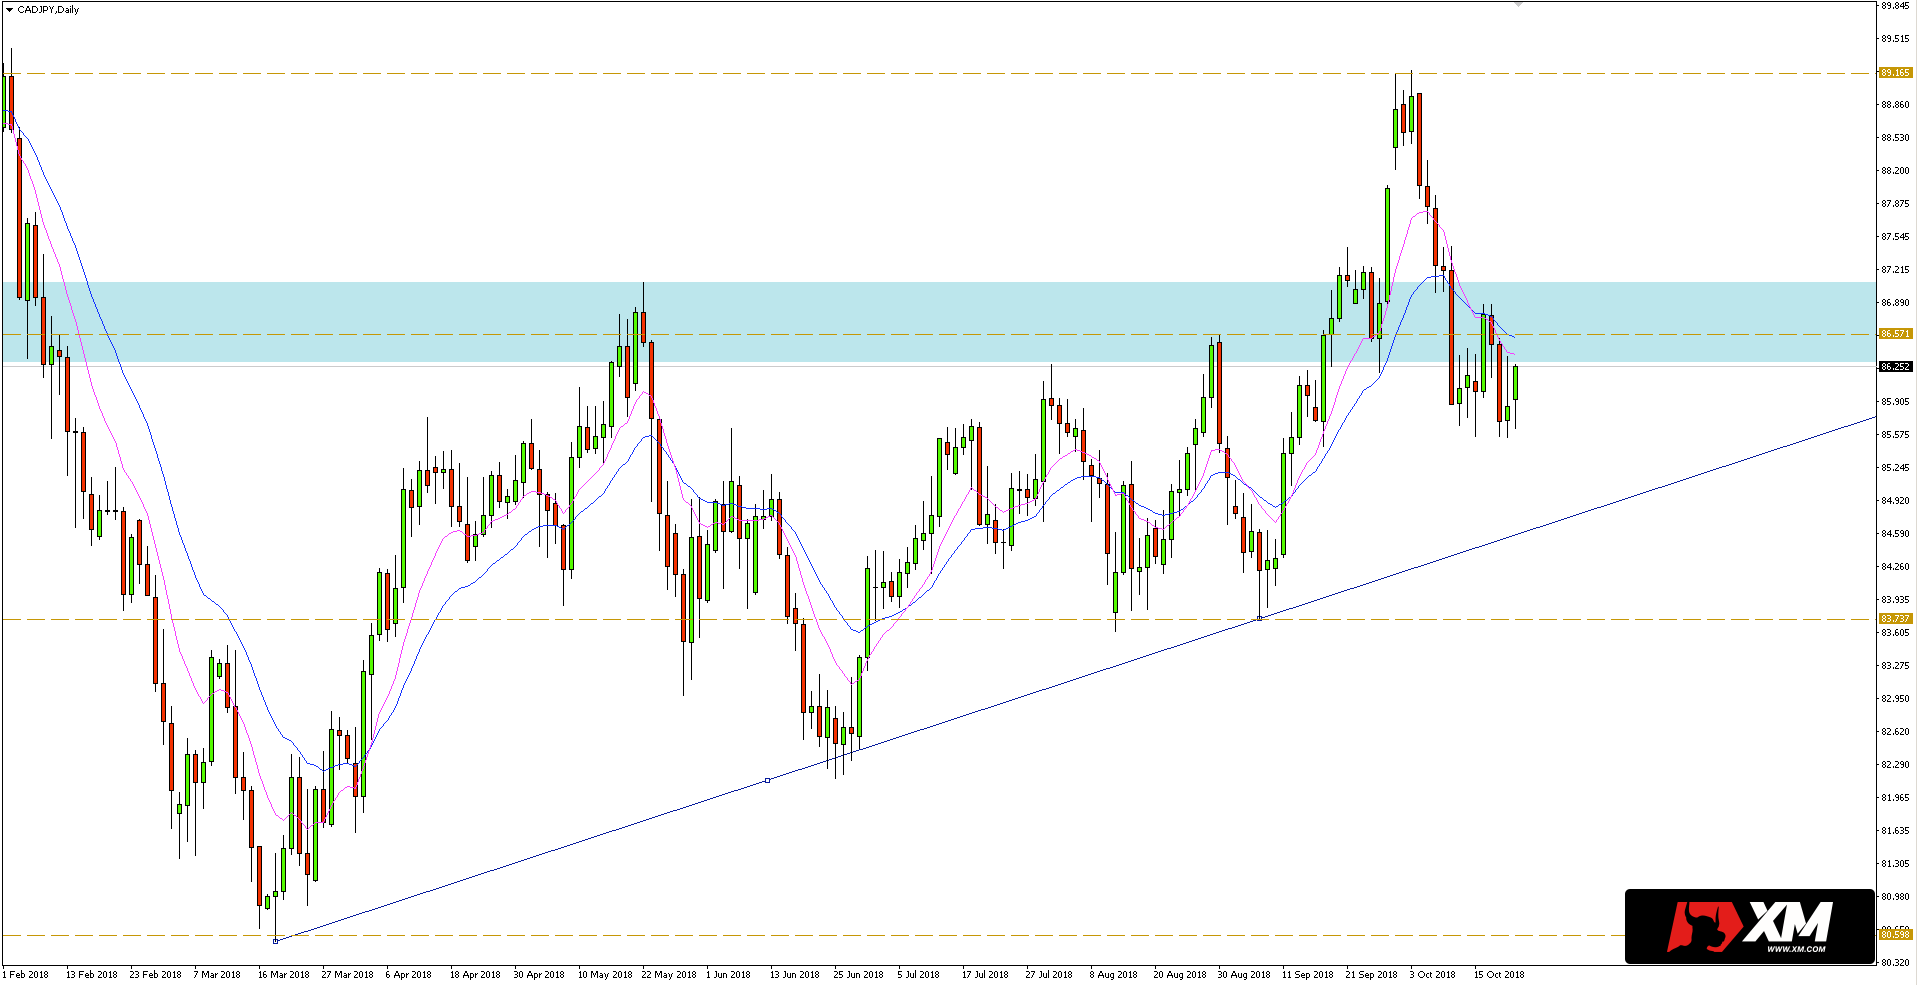
The CADJPY tested the resistance area of 85,577 last week, which was also well-tested as support. As can be seen in the daily chart below, this zone coincides with dynamic resistance in the form of an EMA 10/20 average channel, which provides an additional factor of confluence. If the sellers maintain control in this market, the nearest goal seems to be a downward trend line running from the bottom of this year’s lows. First, however, bears have to beat local support at 85.54, which is around the last week’s minima. Alternatively, closing the day back above the confluence of resistance will question the bearish attitude. Such a scenario would open the way for increases towards the peak at 89.20.


 Review")


