EURGBP was supported around 0.8868. As can be seen in the daily chart below, this level has recently proved itself in its role both in July and August this year, and earlier it acted as a resistance.
On Friday, a large demand candle was created on the chart. What is worth emphasizing, such a large one-day growth has not been recorded on this pair since November last year.
In turn, in the current week Friday’s growth is corrected, and the price has already reached local support within 0.8925. The correction took the form of a downward channel, which is better illustrated on the 1-hour chart.
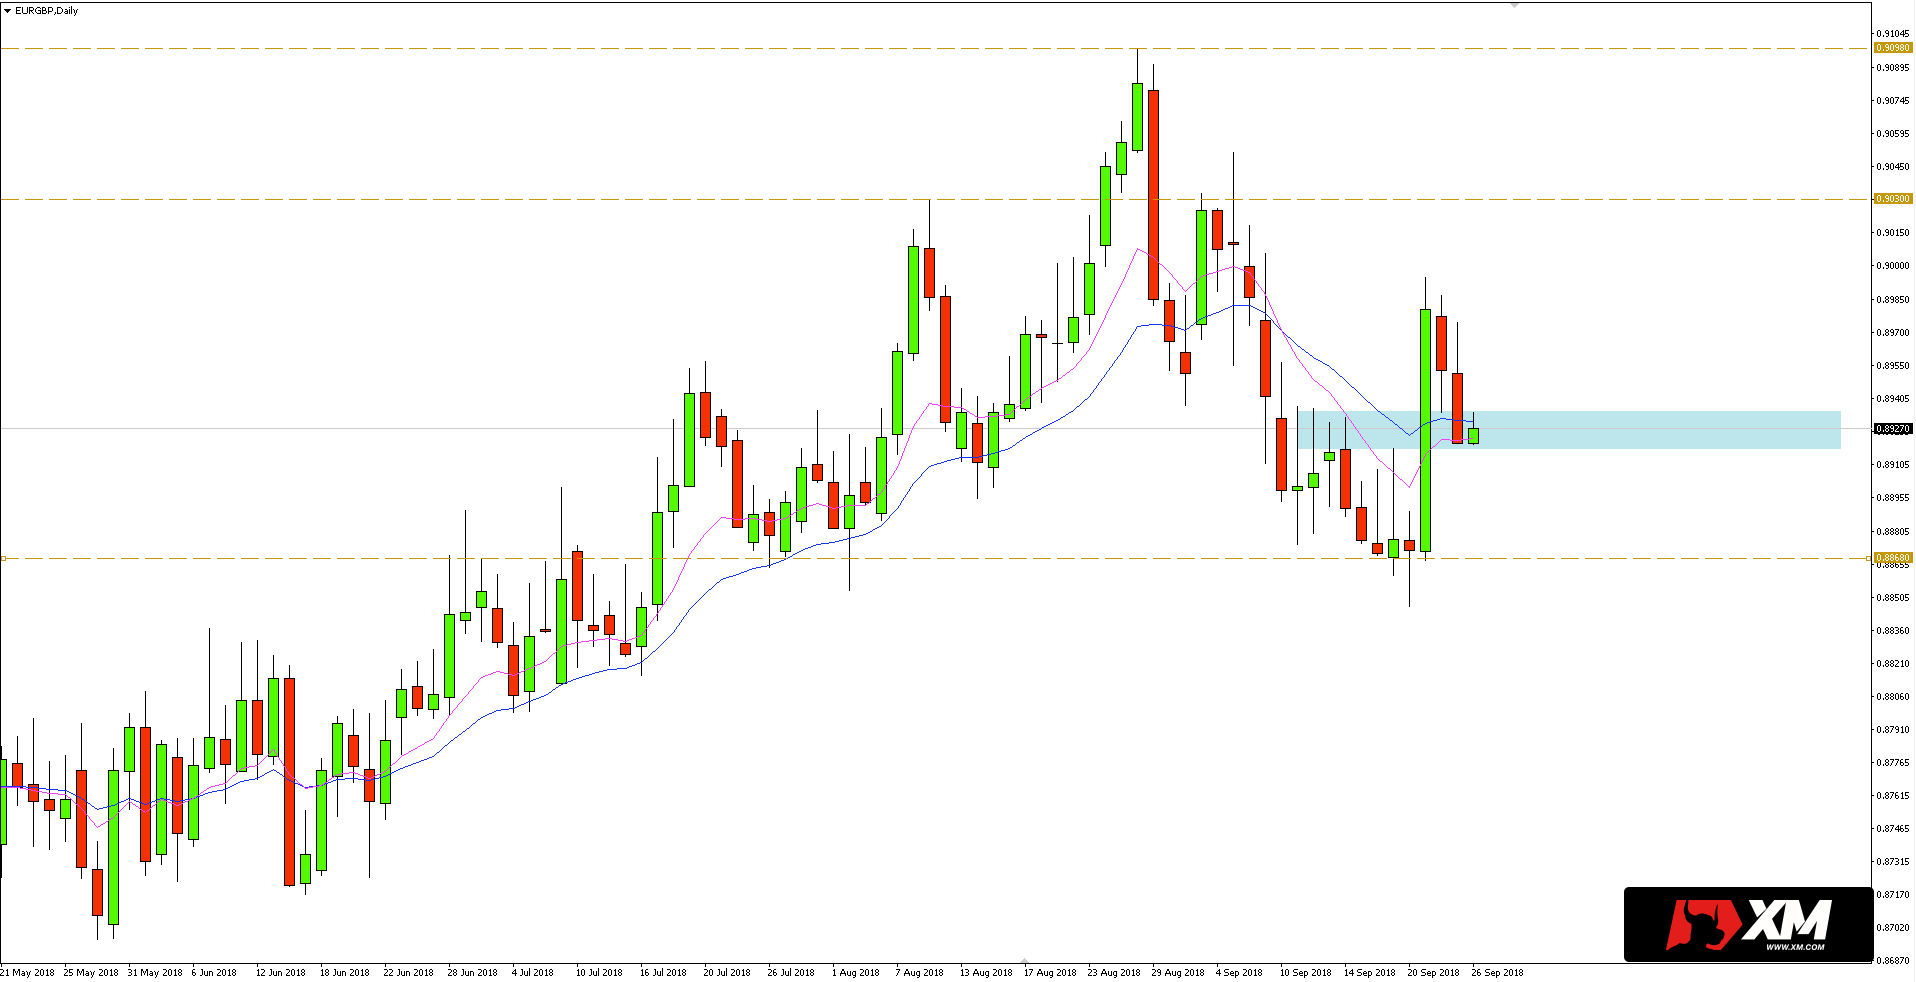 If, therefore, buyers manage to maintain local support at 0.8925, and additionally there is a break out from declining channel, there will be a chance to continue growth. The next significant resistance in such a scenario can be found around 0.9030, and another at this year’s maximum at 0.9098.


 Review")


