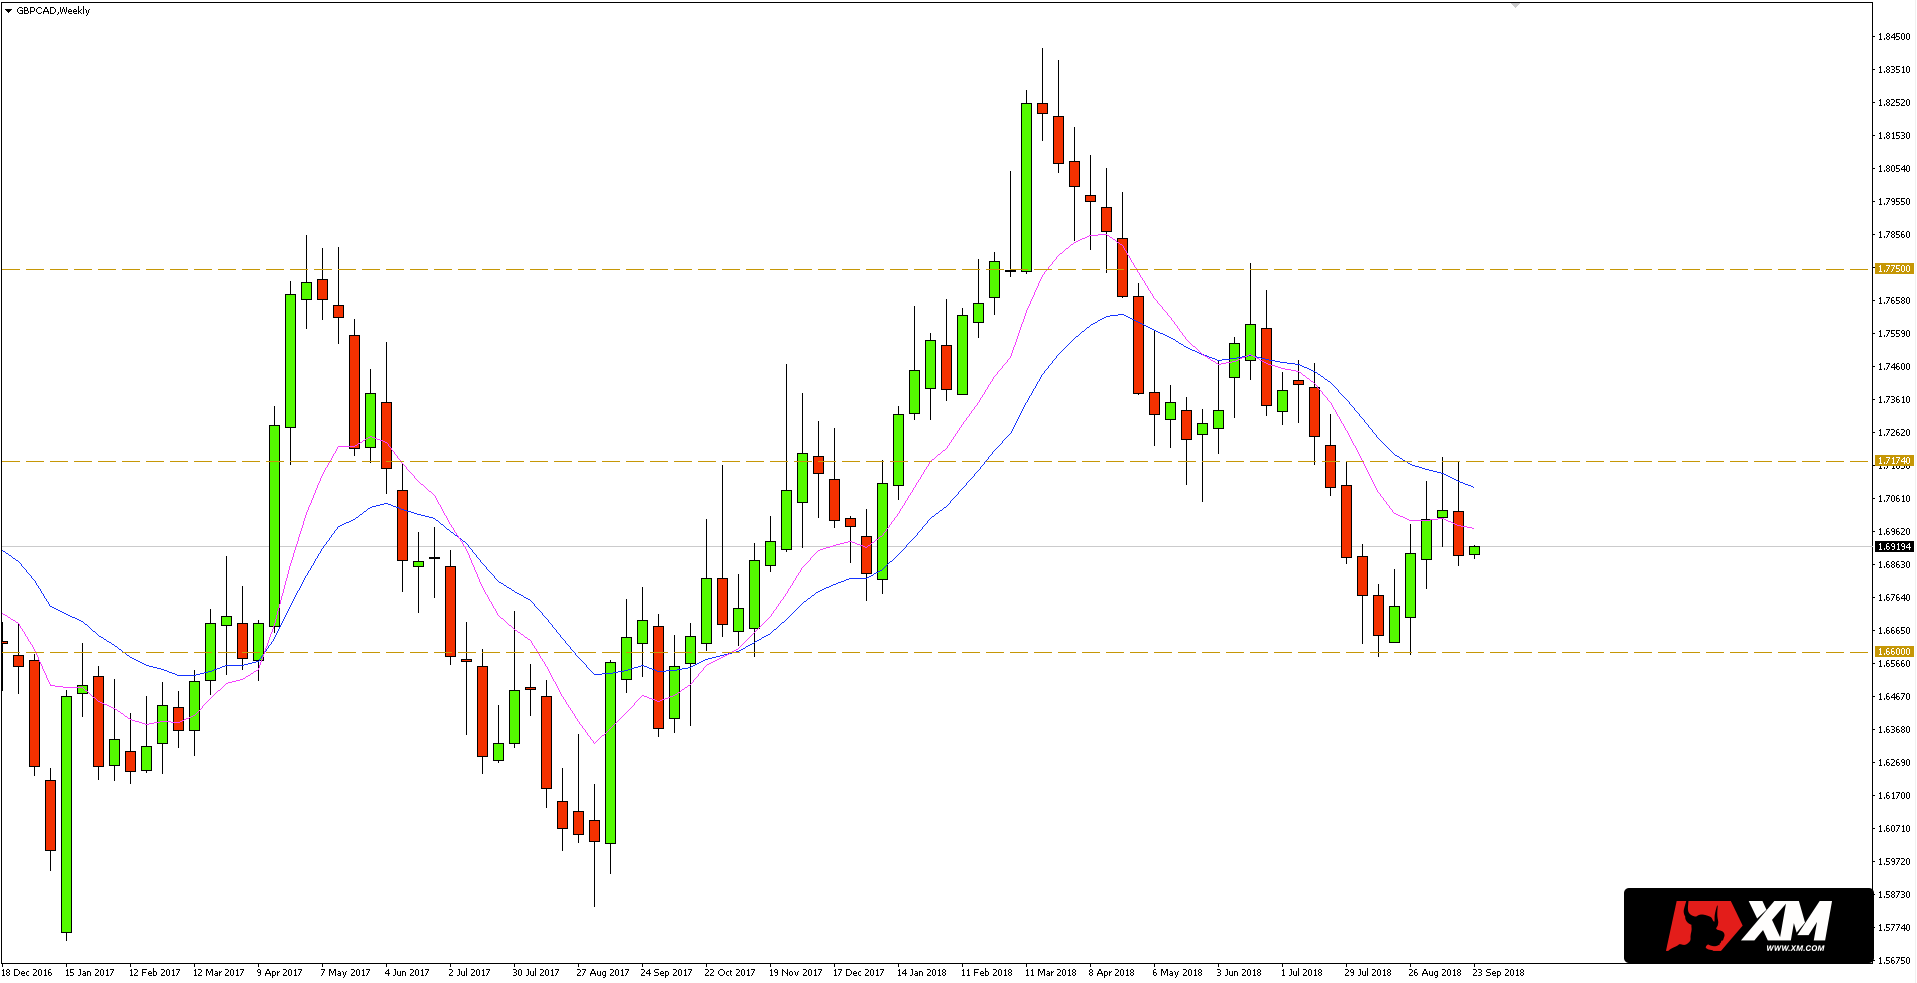
The last time I analysed the GBPCAD currency pair I mentioned almost two weeks ago, noting the downward trend that prevails on the weekly chart. In addition, the quotations were then in the resistance confluence zone encompassing several significant levels:
a horizontal area within 1.7200
20-week moving average (EMA)
50% abolition of the last impulse
I trade on this instrument at broker XM, which has in its offer more than 300 other assets >>
Currently, it seems that the upward correction could have been completed as indicated by the bearish candle rejecting the confluence of resistance created by the last week’s price action.
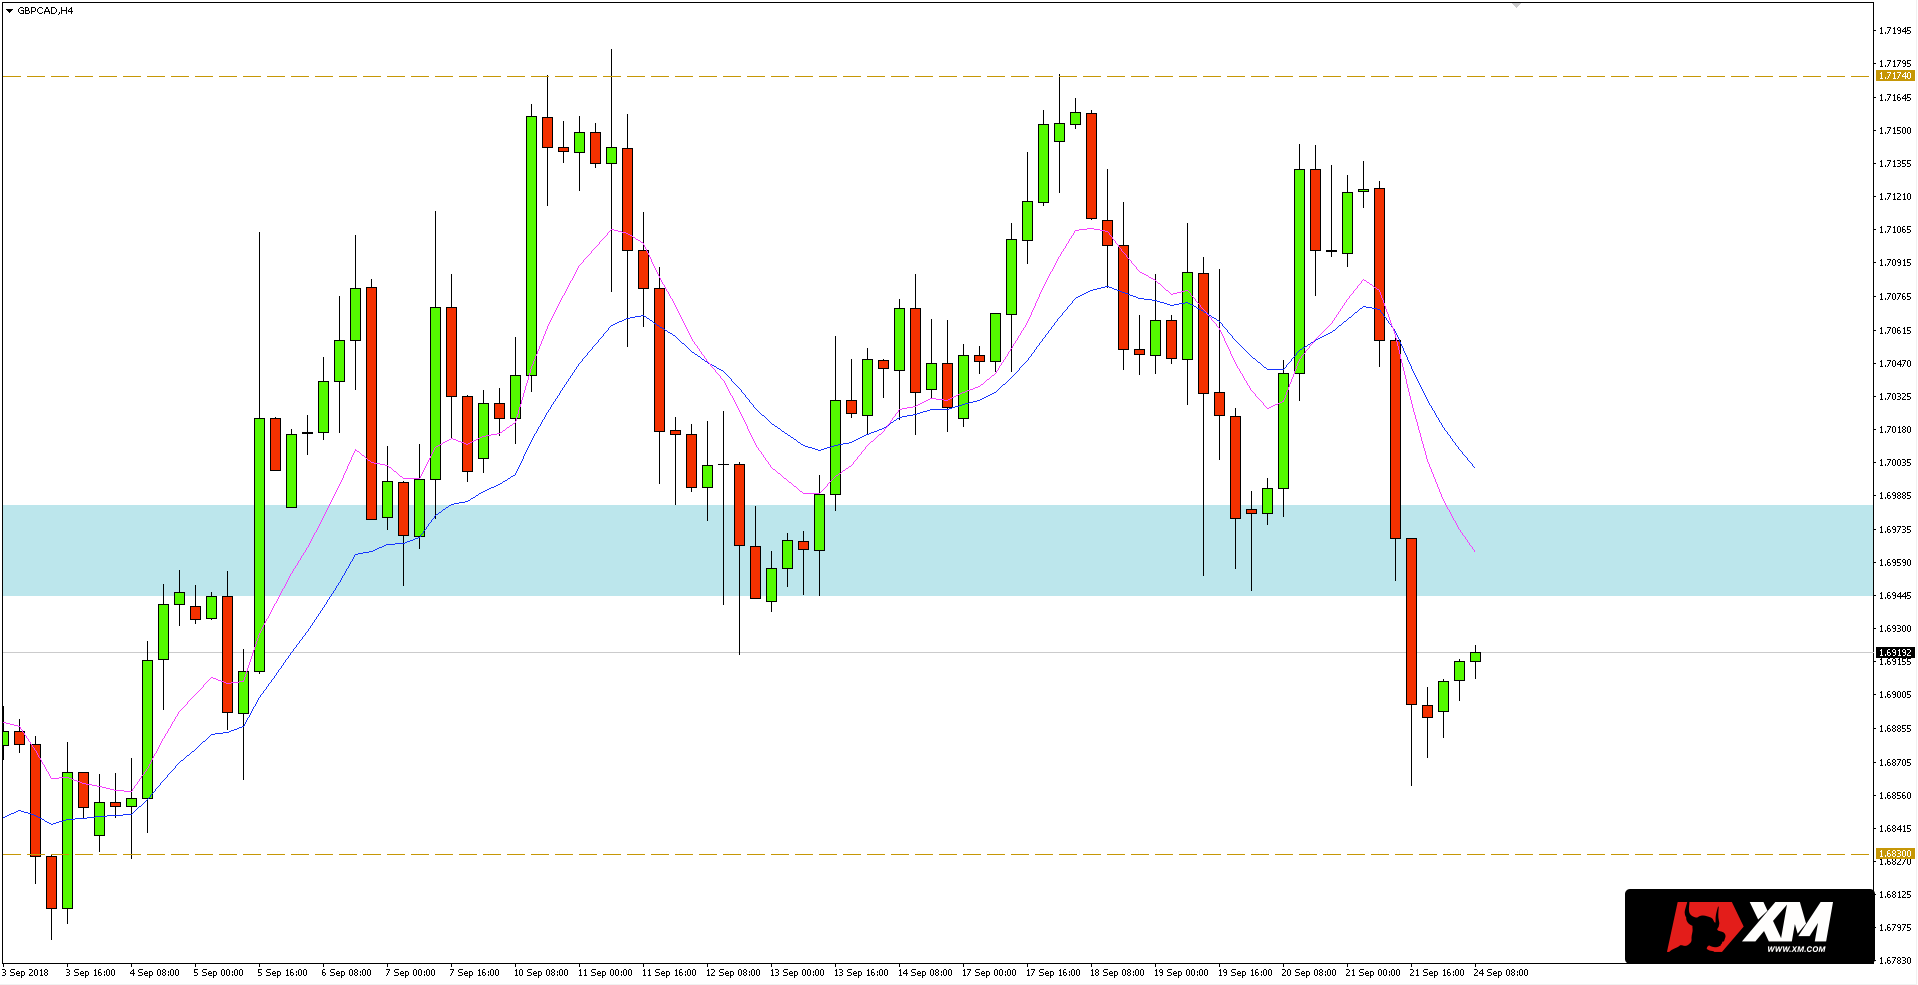
 The potential opportunity to enter a short position can be found on the 4-hour chart, where the local support area within 1.6960 was breached. At present, this zone should be a resistance.
The nearest local support that sellers can reach is at 1.6830. Another key level of defence can be found in the vicinity of 1.6600.


 Review")


