GBPCHF has recently consolidated, and this movement took a form of a triangle visible on the 4-hour chart below. Today, however, we are witnessing an attempt to overcome the upper limit of this technical formation. I am writing here about a try, as so far the quotations have not yet closed on the 4-hour chart (intraday) over the abovementioned resistance, not to mention closing the day and week candle.
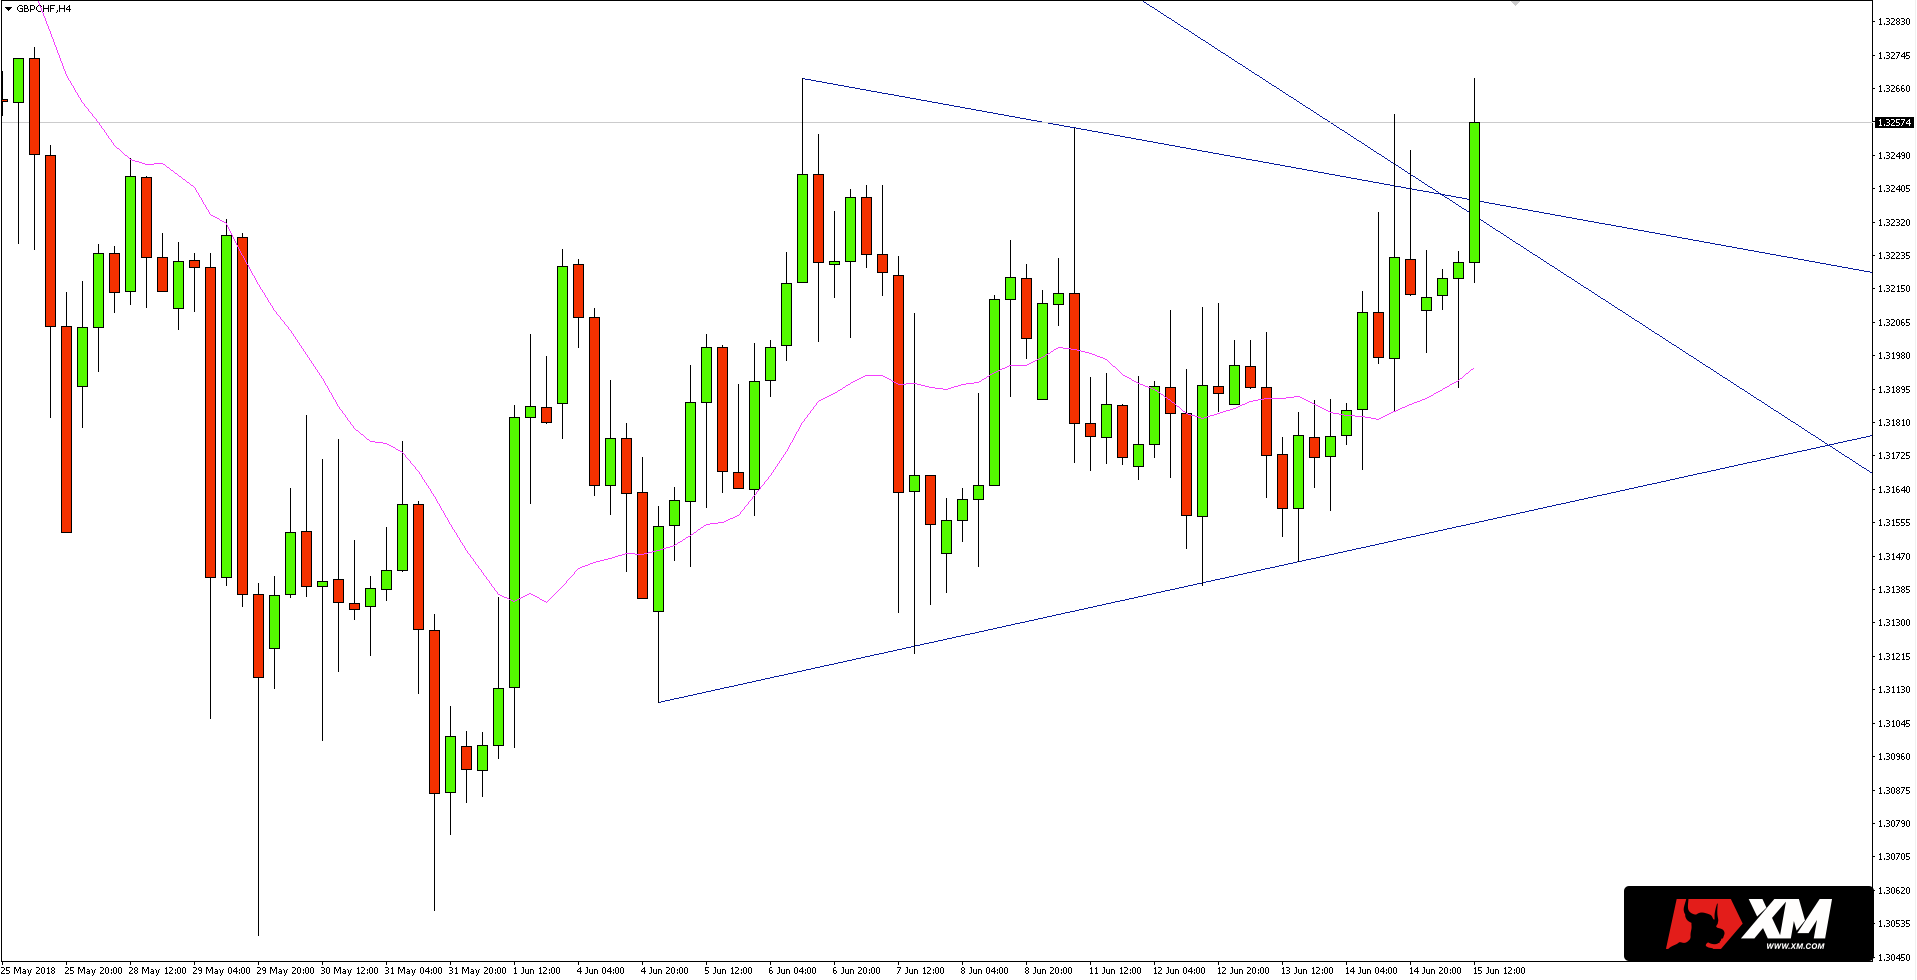 However, it is worth bearing in mind this pair, because if today’s session closes at the current levels, not only the upper limit of the triangle will be overcome, but also the accelerated downward trend line running from the April 27 summit.
I trade on this instrument at broker XM, which has in its offer more than 300 other assets >>
It would get interesting if the closing of the week took place over the current maximum(1.3269) from the current month. In that case the buyers would have exposed the resistance at 1.3370 and the trend line running from this year’s highs.
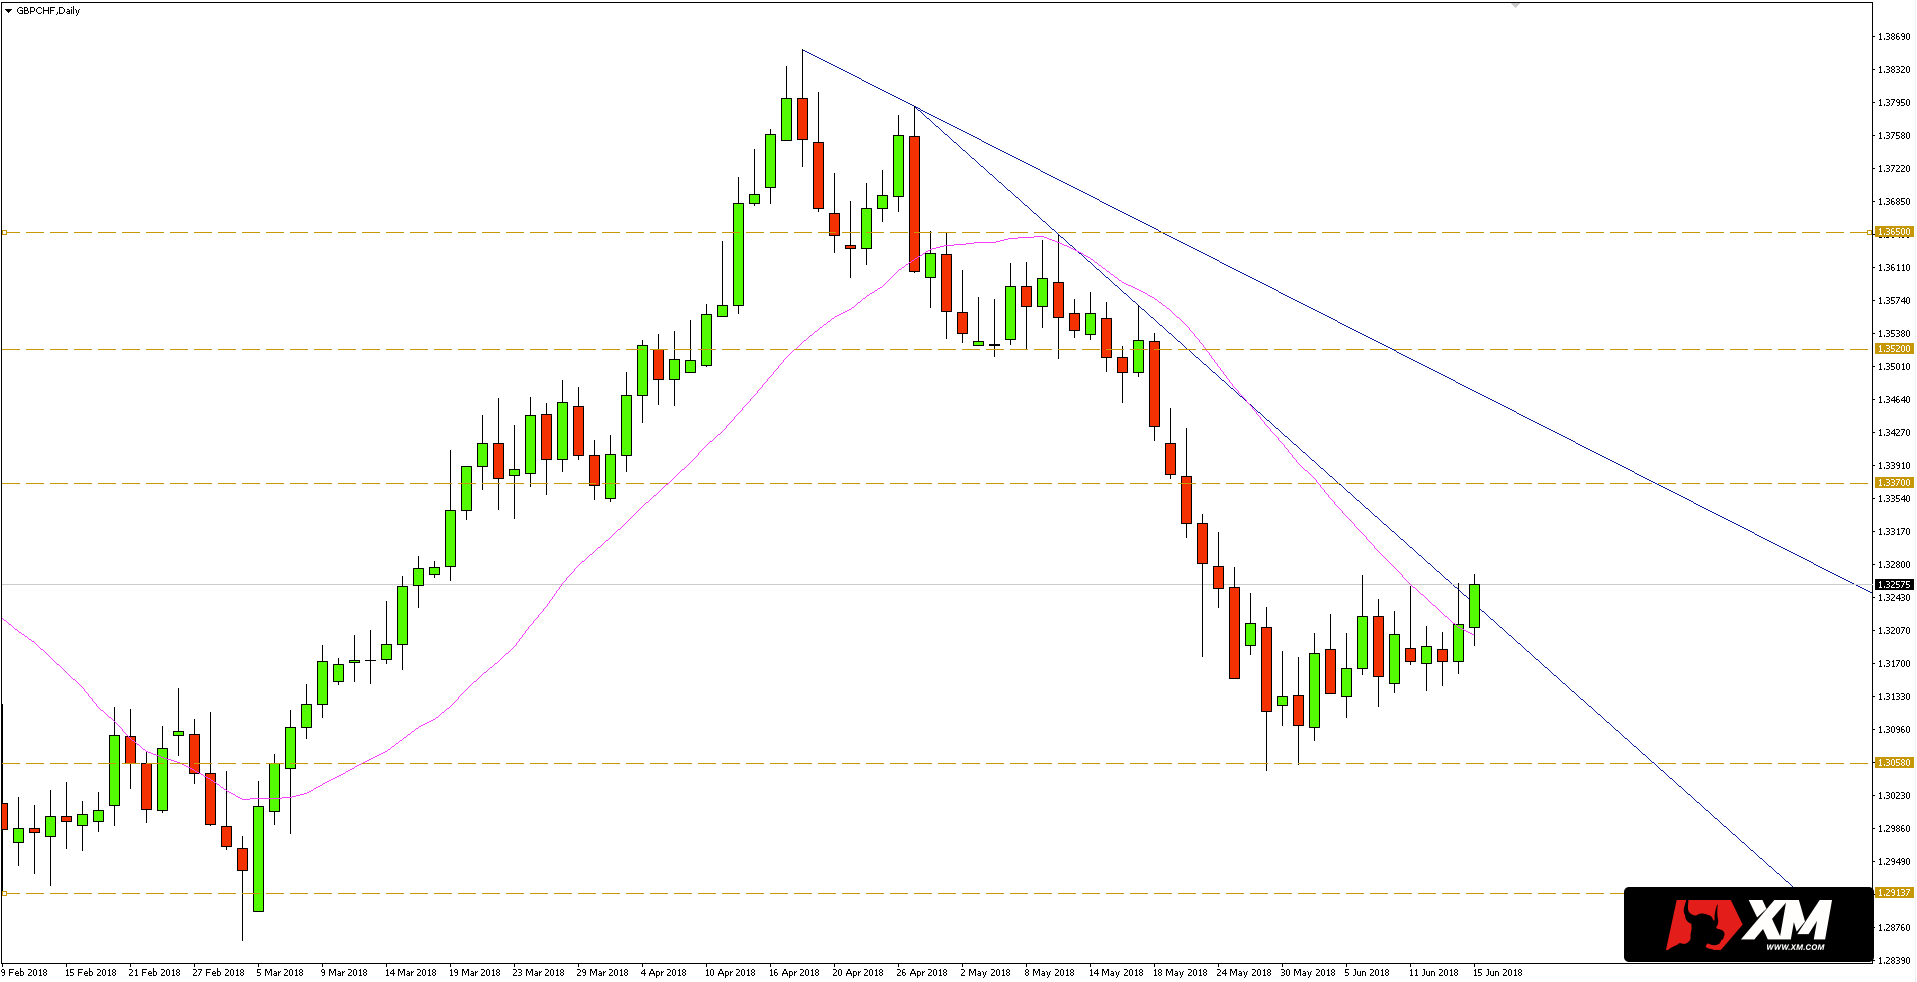 It should be remembered that this breakdown can only be a deepening of the correction. As it can be seen in the daily chart below, in the broader context, the supply side continues to be in force the whole time.


 Review")


