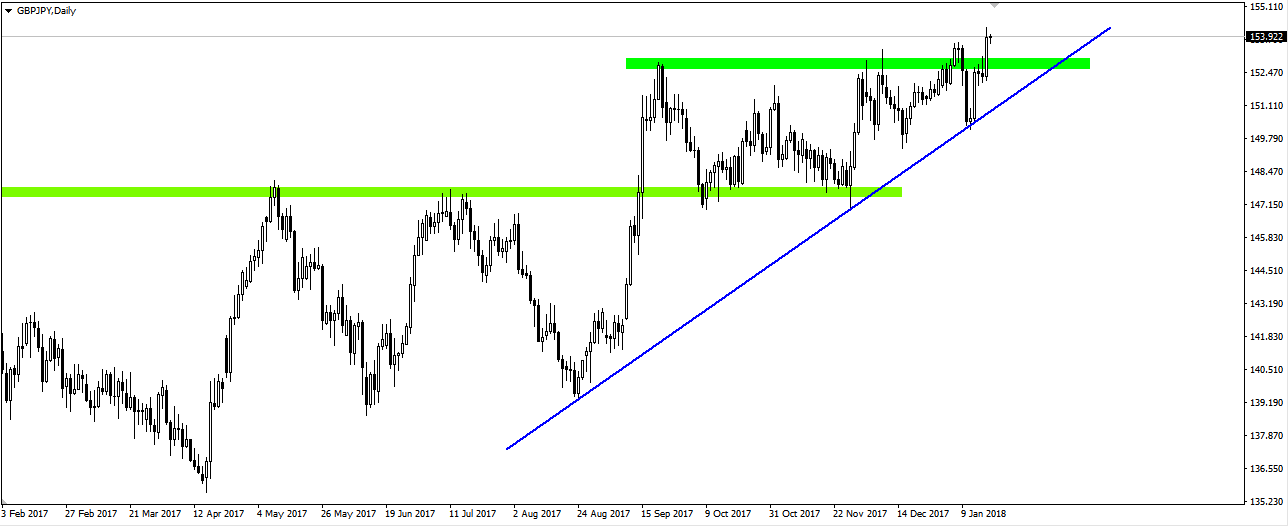
The daily chart of GBP/JPY shows that it has just reached new highs in the trend lasting since October 2016. It seems that it can be treated as a signal of trend continuation, the more that looking at the history, the price is still at low level. Similar corrections occur quite often. Here we have very close support based on the previous peaks and a well-respected trend line connecting the last three lows. So if there is a correction, more or less in this area you can look for its potential end.
I trade on this instrument at broker XM, which has in its offer more than 300 other assets >>


 Review")


