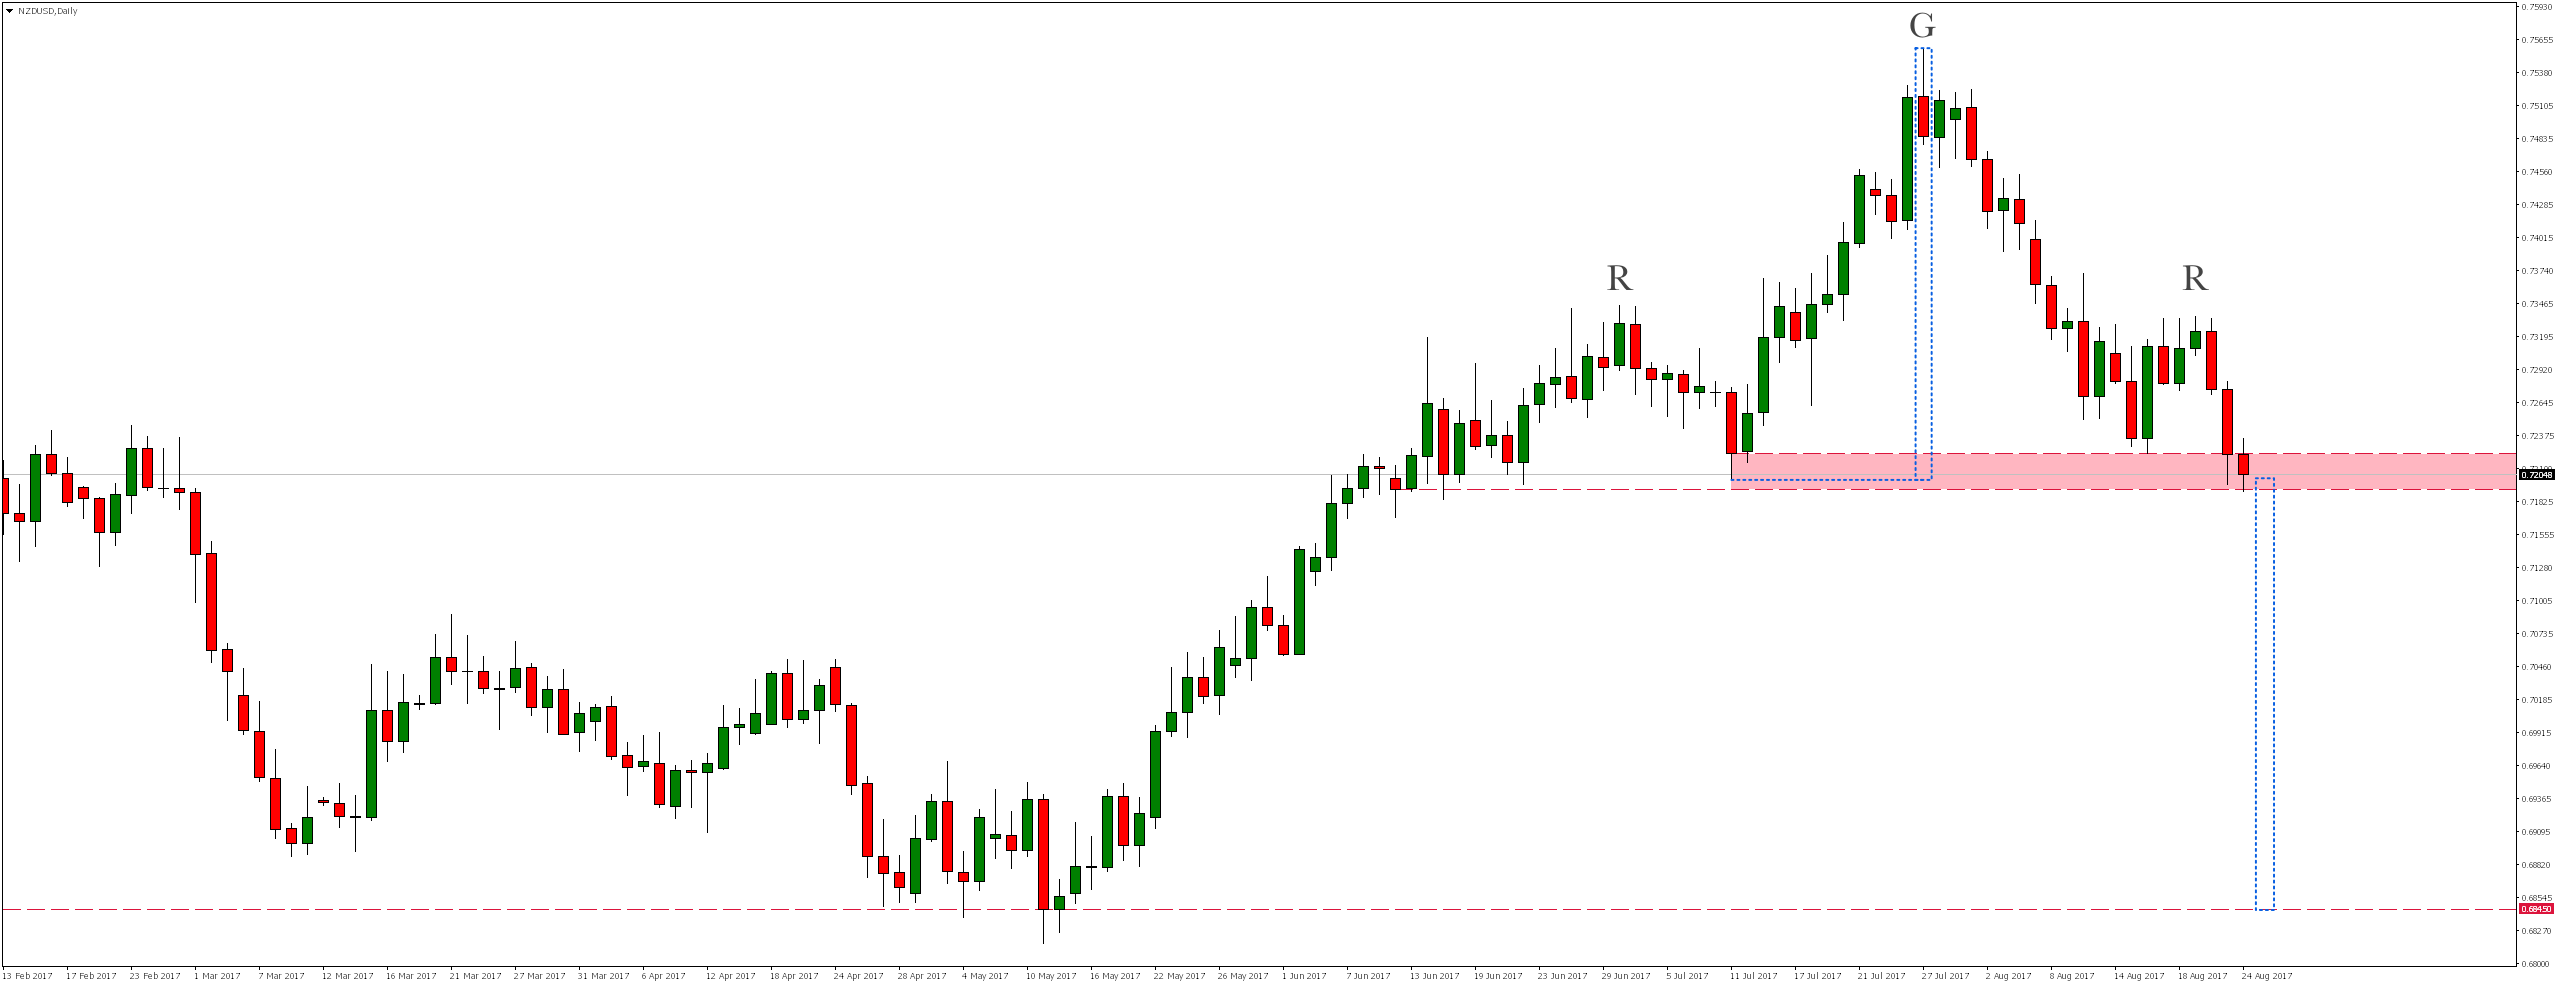
On daily chart of NZDUSD we will notice that the market since July 27th is moving south. During these declines only one lasting for few days growth correction occurred, so the current technical outlook is similar to head and shoulders formation (H&S). We are now in a zone that we could call the neckline of that formation. Breaking down could confirm the bearish formation and open the way to further declines. Taking into account that the technical range of head and shoulders formation coincides precisely with the support level of 0.6845, it is that area that we would expect declines will reach in case of a bearish scenario. As I already mentioned, in order for this to happen we would have to break the bottom of the current support zone.


 Review")


