The first, full week of March this year ended with creating on weekly chart a bearish pin bar testing resistance at 1.2900. This formation usually indicates a reversal and potential for declines.
However, this time the pin bar just did not work. As we see on the weekly chart below, the pair closed last week far above the maximum of this formation.
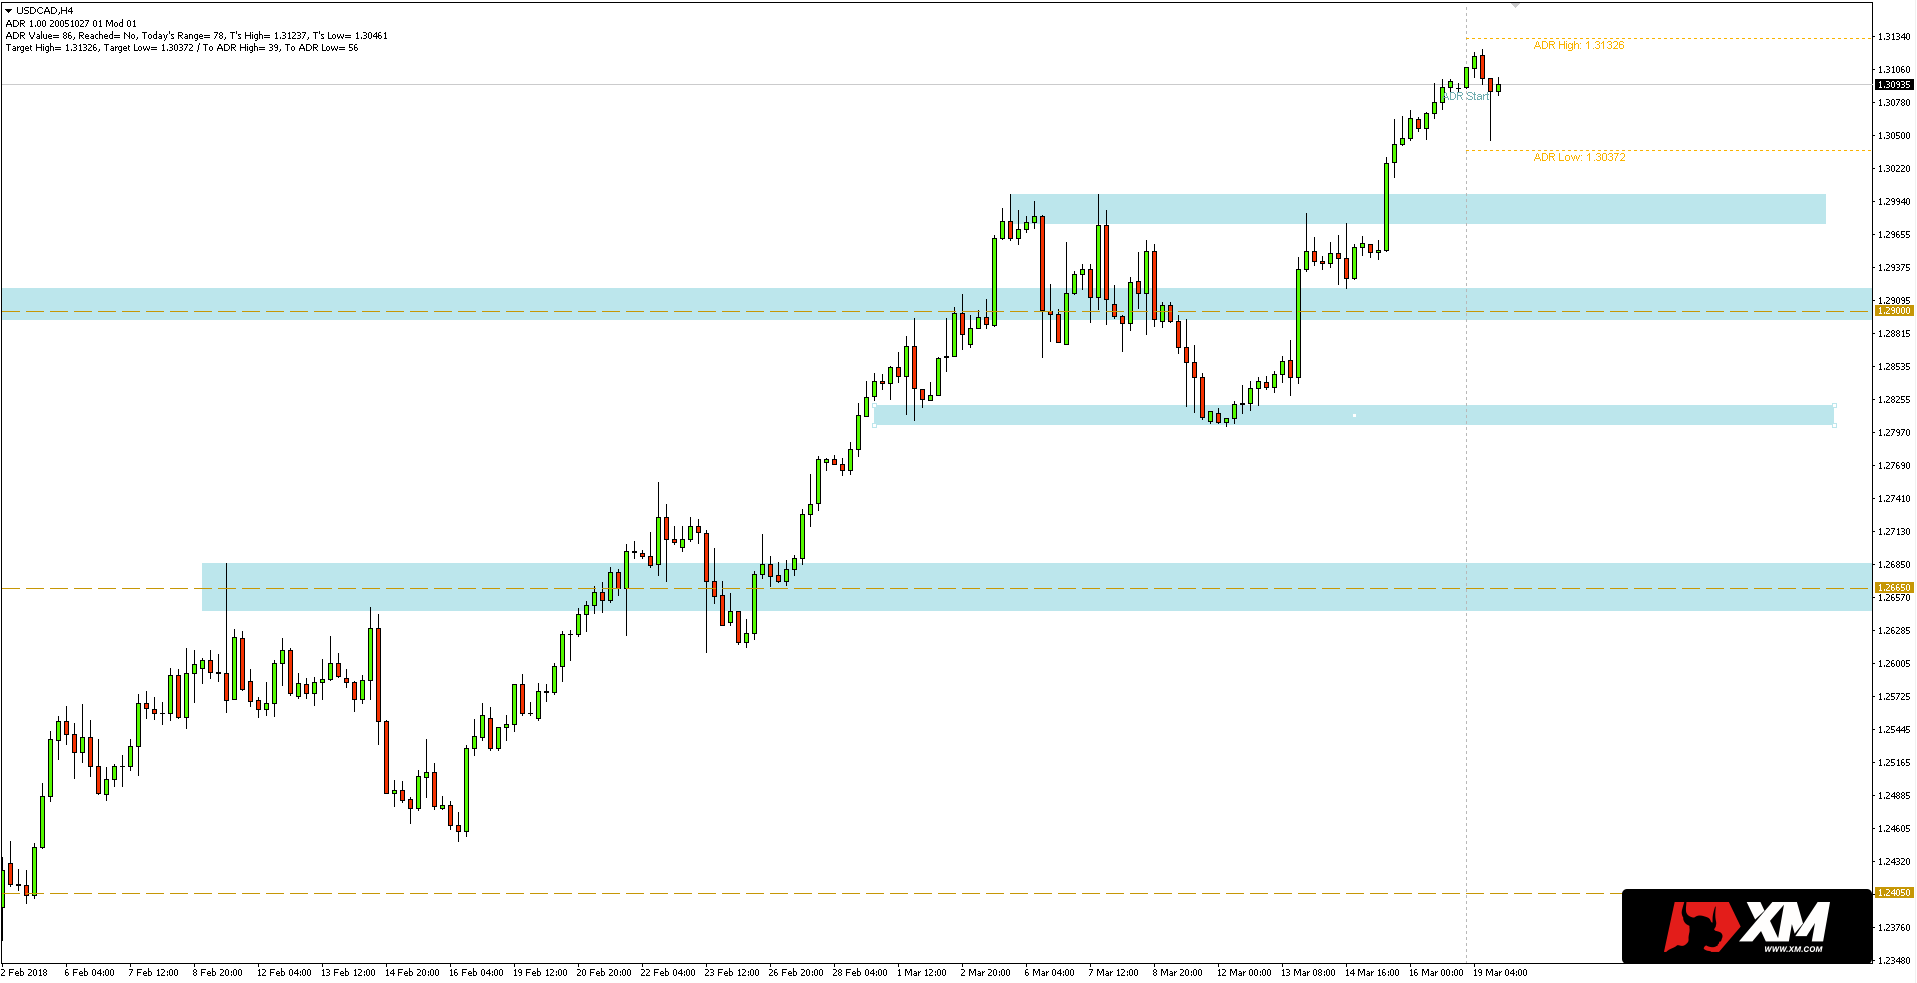
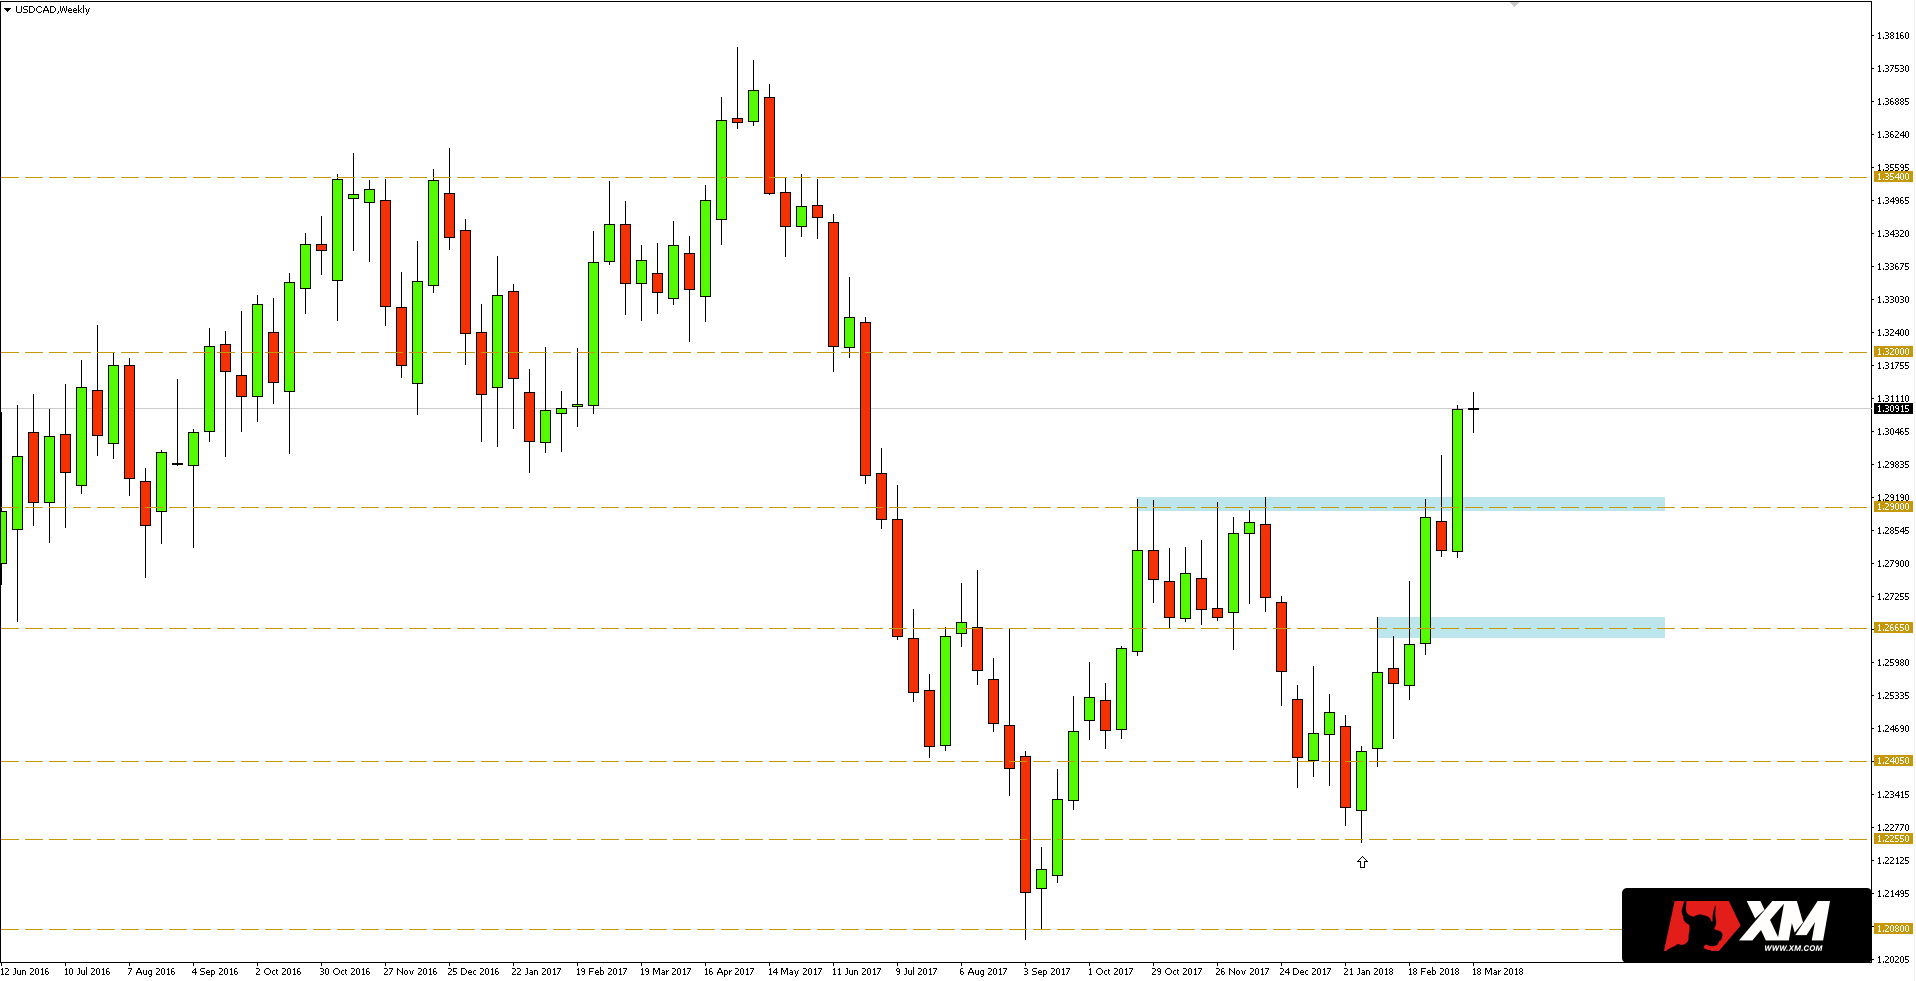 The strength of the bulls after breaking new highs and breaking the resistance at 1.2900 now suggests searching for longs, in line with the prevailing momentum. The next support for such a scenario can be found on the previous resistance at 1.2900. Another important defense zone is close to 1.2665. It is worth to pay attention to horizontal short-term supports, which are marked on the 4-hour chart below.
I trade on this instrument at broker XM, which has in its offer more than 300 other assets >>
In turn, the target for potential long positions may be a key resistance at 1.3200. Its defeat would open the way for increases in the direction of 1.3540.


 Review")


