AUDCAD reached the key support area close to 0.96 this month. As you can see in the weekly chart below, this area defended against declines in December 2017, but also a year earlier.
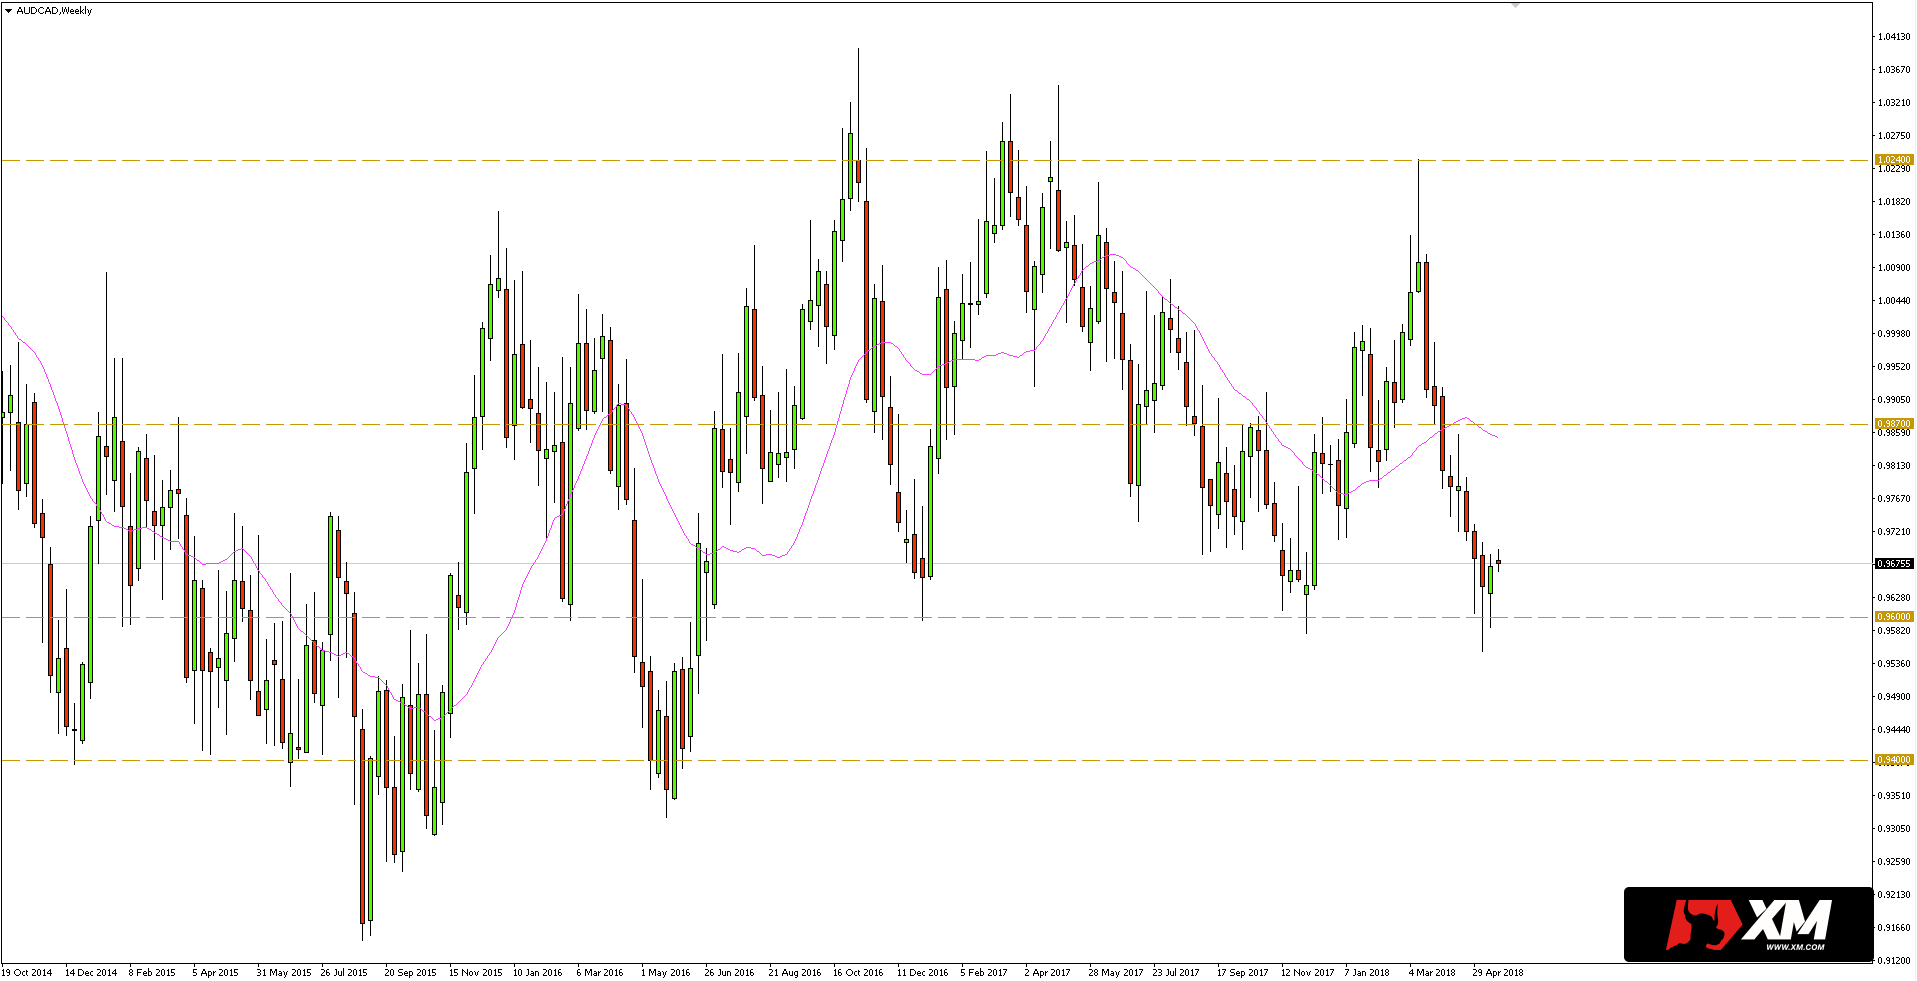 Bearing in mind the above, there is a chance of reflection also now. The first signs of potential for growth were visible last week, which closed in green. In turn, on the 4-hour chart, an upward sequence of highs and lows is formed. The quotations are still here, however, under the short-term resistance zone within 0.9700. If, however, the buyer managed to overcome this resistance, the way to the next defence zone within 0.9870 will be opened. Otherwise, the support level is still at 0.9600.
I trade on this instrument at broker XM, which has in its offer more than 300 other assets >>


 Review")


