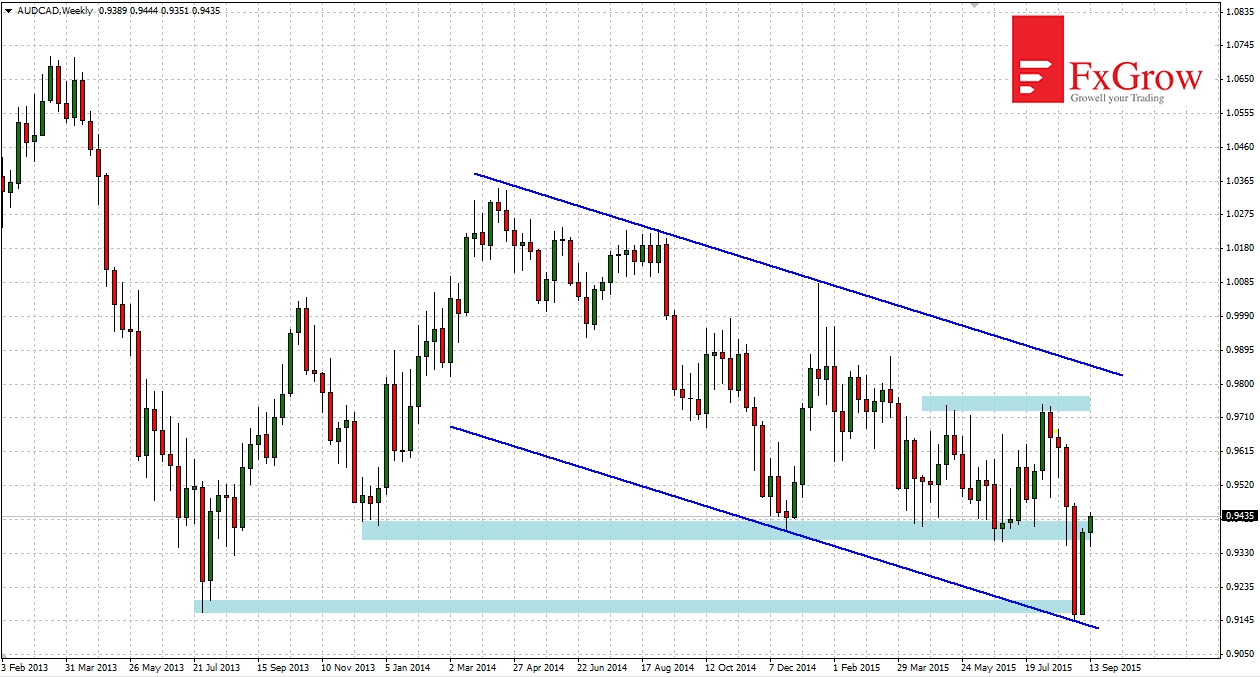
According to the analysis for the beginning of September the price has tested the support 0.9160 (from 2013). Support was target for the bears and for the bulls. The bears were closing short positions and the bulls were opening a long positions here. As a result, the weekly chart shows the strong bull candle, which stopped at the resistance. On the weekly chart, we can draw quite precisely the downward channel, in which the price moves for 1.5 years. At this moment bulls are trying to break above resistance at 0.9400. If it proves successful the level of 0.9740 will be the target of upward move.
At the time-frame H4 we can see smaller channel. An attempt of broke below has failed and today the bulls are trying to break above the channel’s top. If the bulls succeeds the next resistance will be at 0.9480. However, the current level is a 50% Fibonacci retracement of last downward move and it may cause bears reaction.


 Review")


