The AUDCAD is moving in a dynamic downward trend, and at the closing of yesterday’s session, the low from May 2016 was broken. Today, however, declines are continuing, and the rate is currently on the levels that were last seen in October 2015.
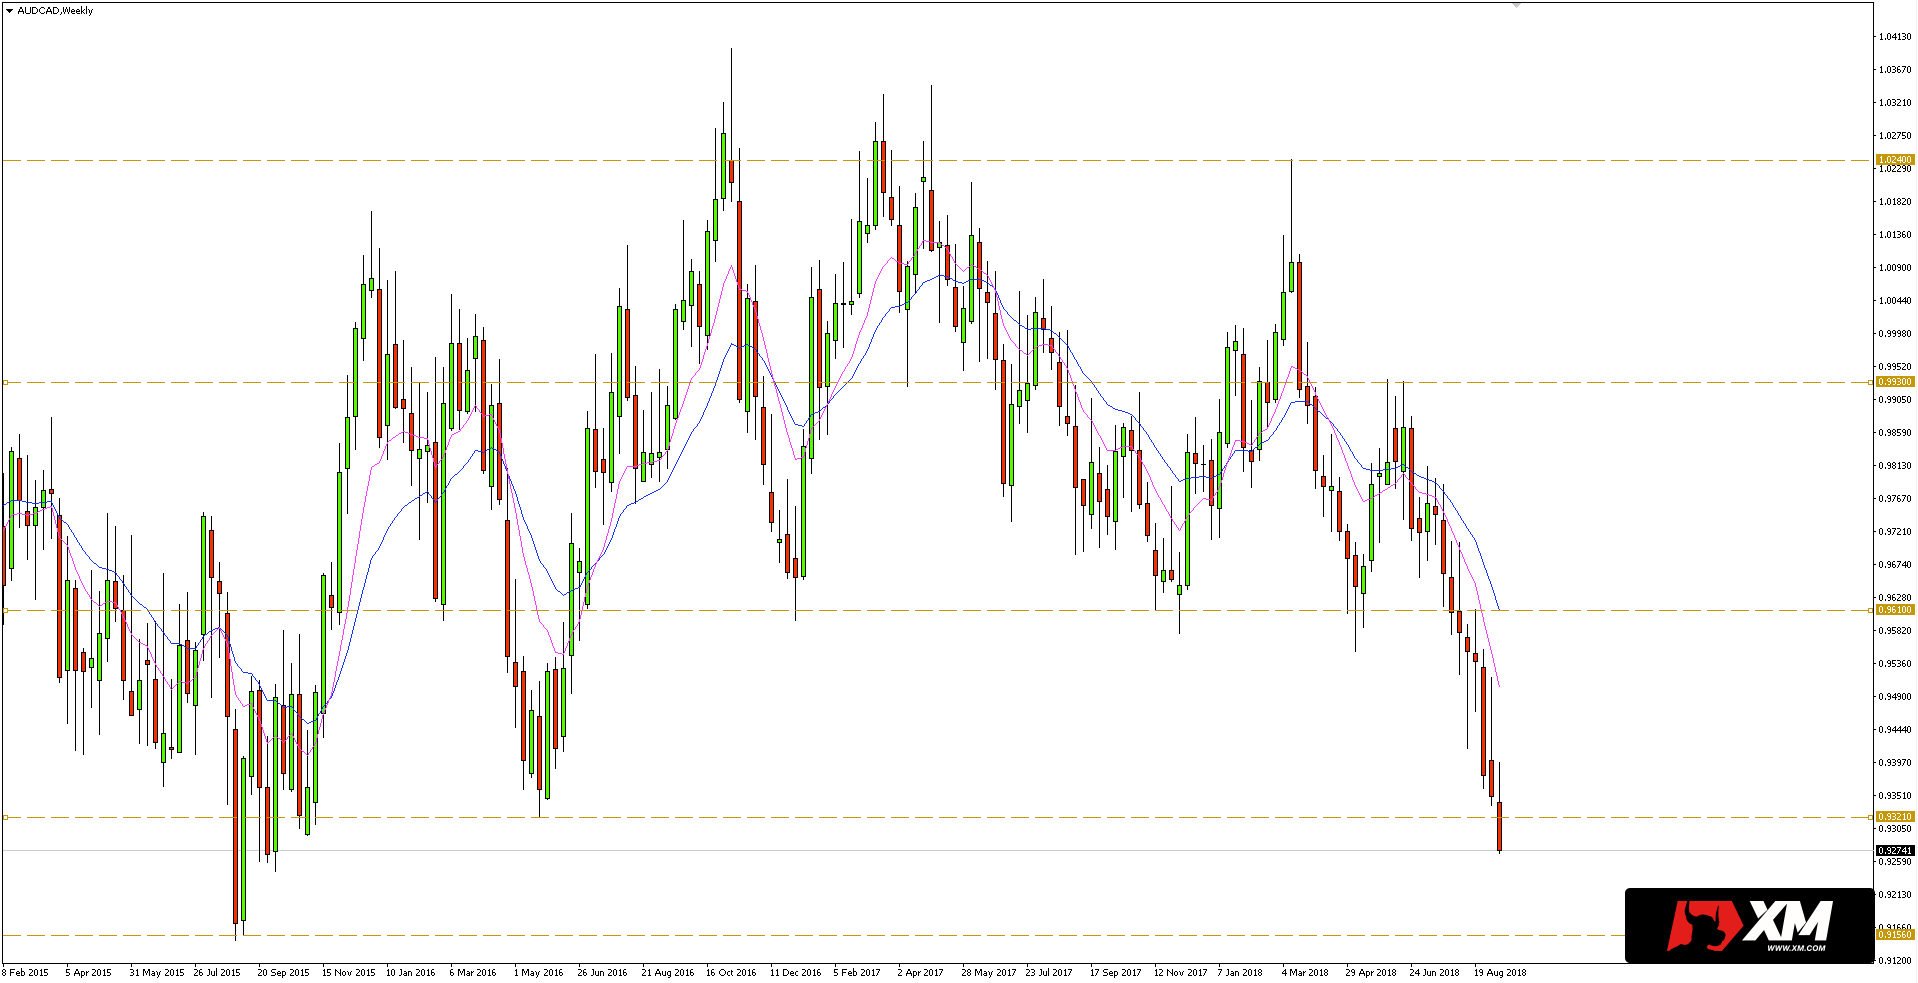 As can be seen in the daily chart below, the price after breaking the horizontal support at 0.9610 well respects the average EMA 10/20 channel, which is a dynamic resistance in the current trend. Considering yesterday’s breakout, traders may still look for opportunities to join the downward trend after correction. Horizontal resistance in such a scenario can be found in the vicinity of 0.9370, but it is also worth observing the above-mentioned channel. Another target for sellers may be around the low from August / September 2015 close to 0.9156.


 Review")


