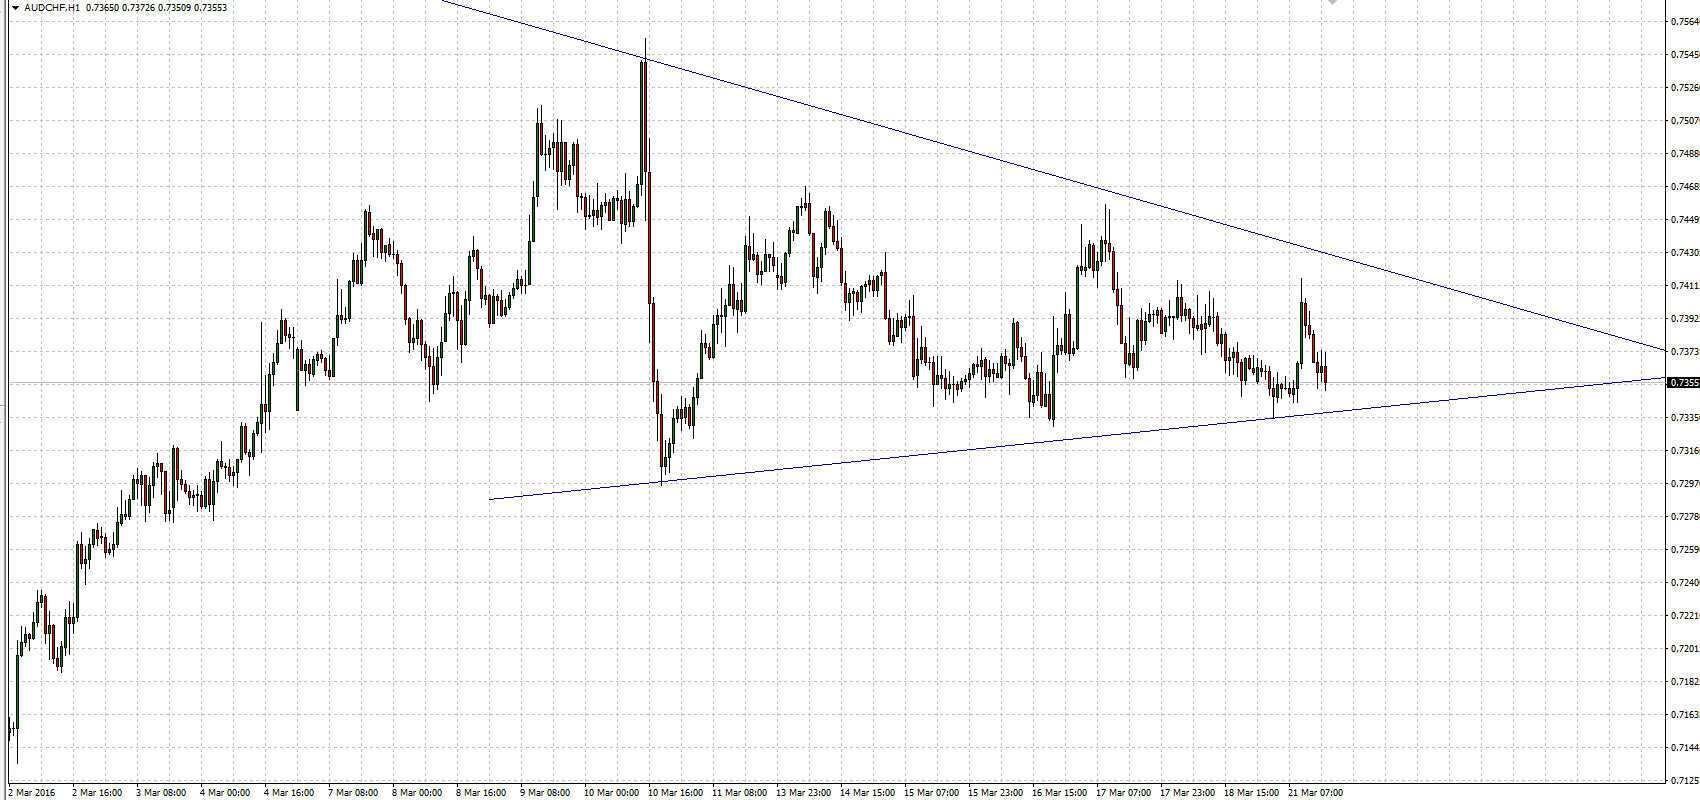
Since almost two weeks AUDCHF is moving inside a triangle. Its breakout will show further direction of price movement. It should occur soon because inside the triangle there is only 100 pips left (0.7330 – 0.7430 range).
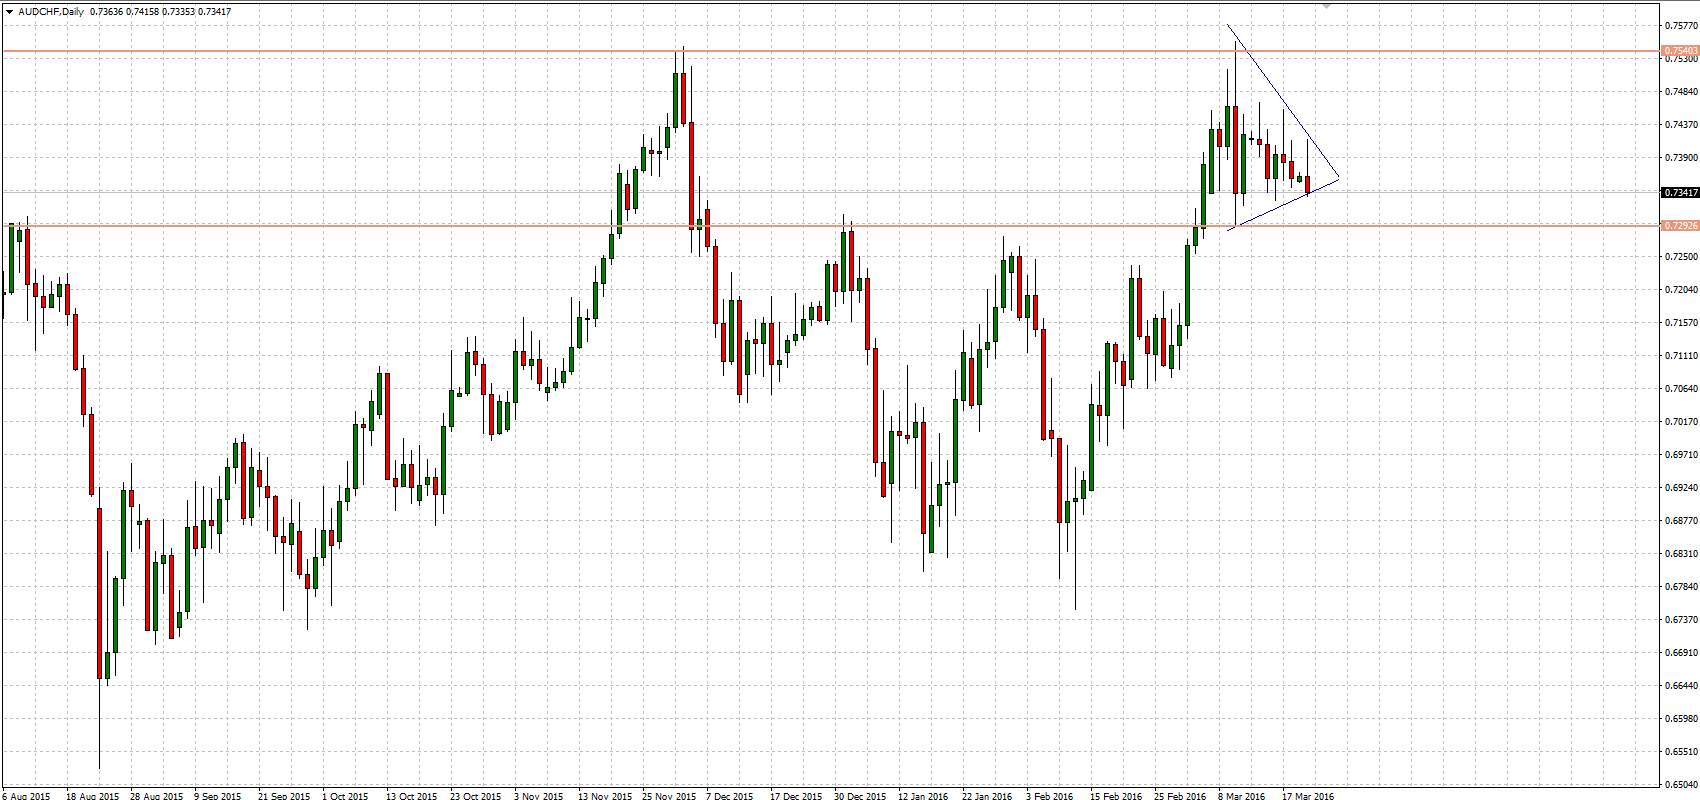
Current chart prefers continuation of upward movement because the triangle pattern is a trend continuation pattern. Furthermore on March 10 price reached 11-months high and AUDCHF right now is just below that level. Key level for demand is located at 0.7540. Break above that level allows new uptrend wave. Alternatively if declines occur nearest support will be located at 0.7300.
Time-frame H1
Time-frame D1


 Review")


