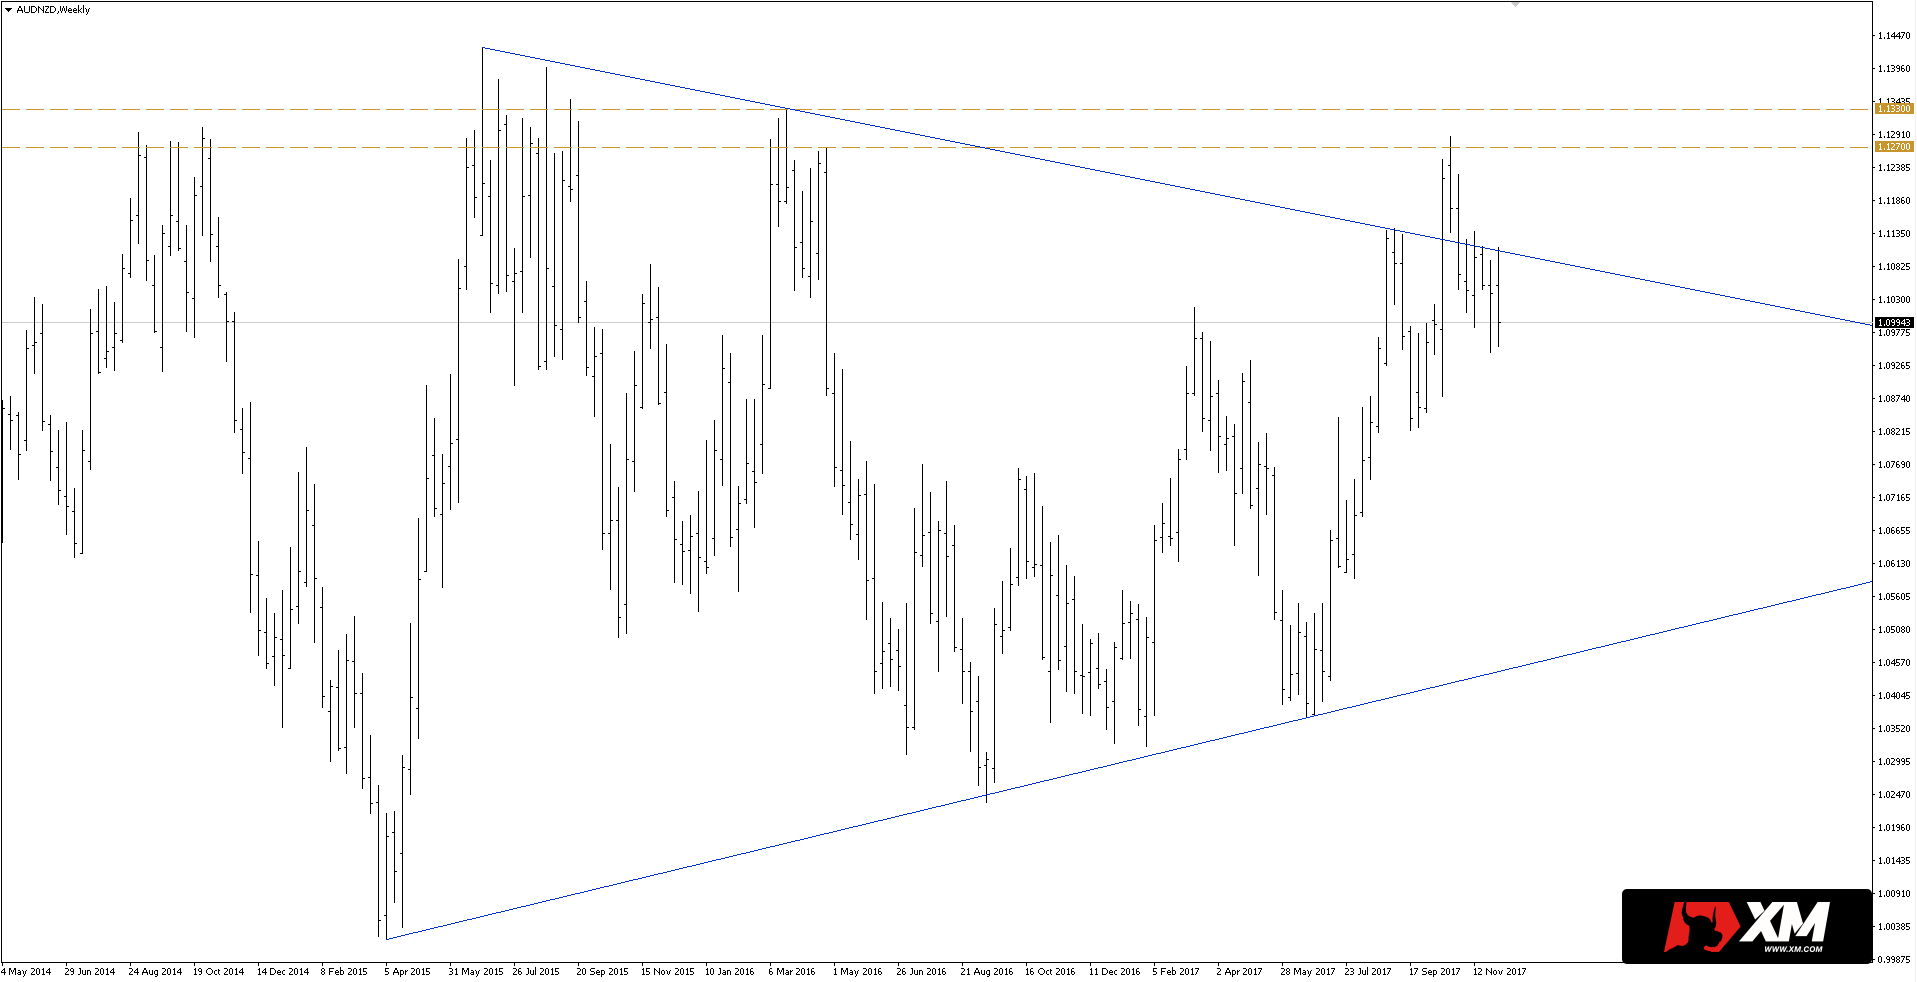
The weekly chart shows a strong break from the more than two-year-old triangle formation that took place in October. One week after this break-up, the pair was able to set a new high and test the key horizontal resistance between 1.1270 – 1.1330, but later the price returned under the upper arm of the triangle, where it stays until now.
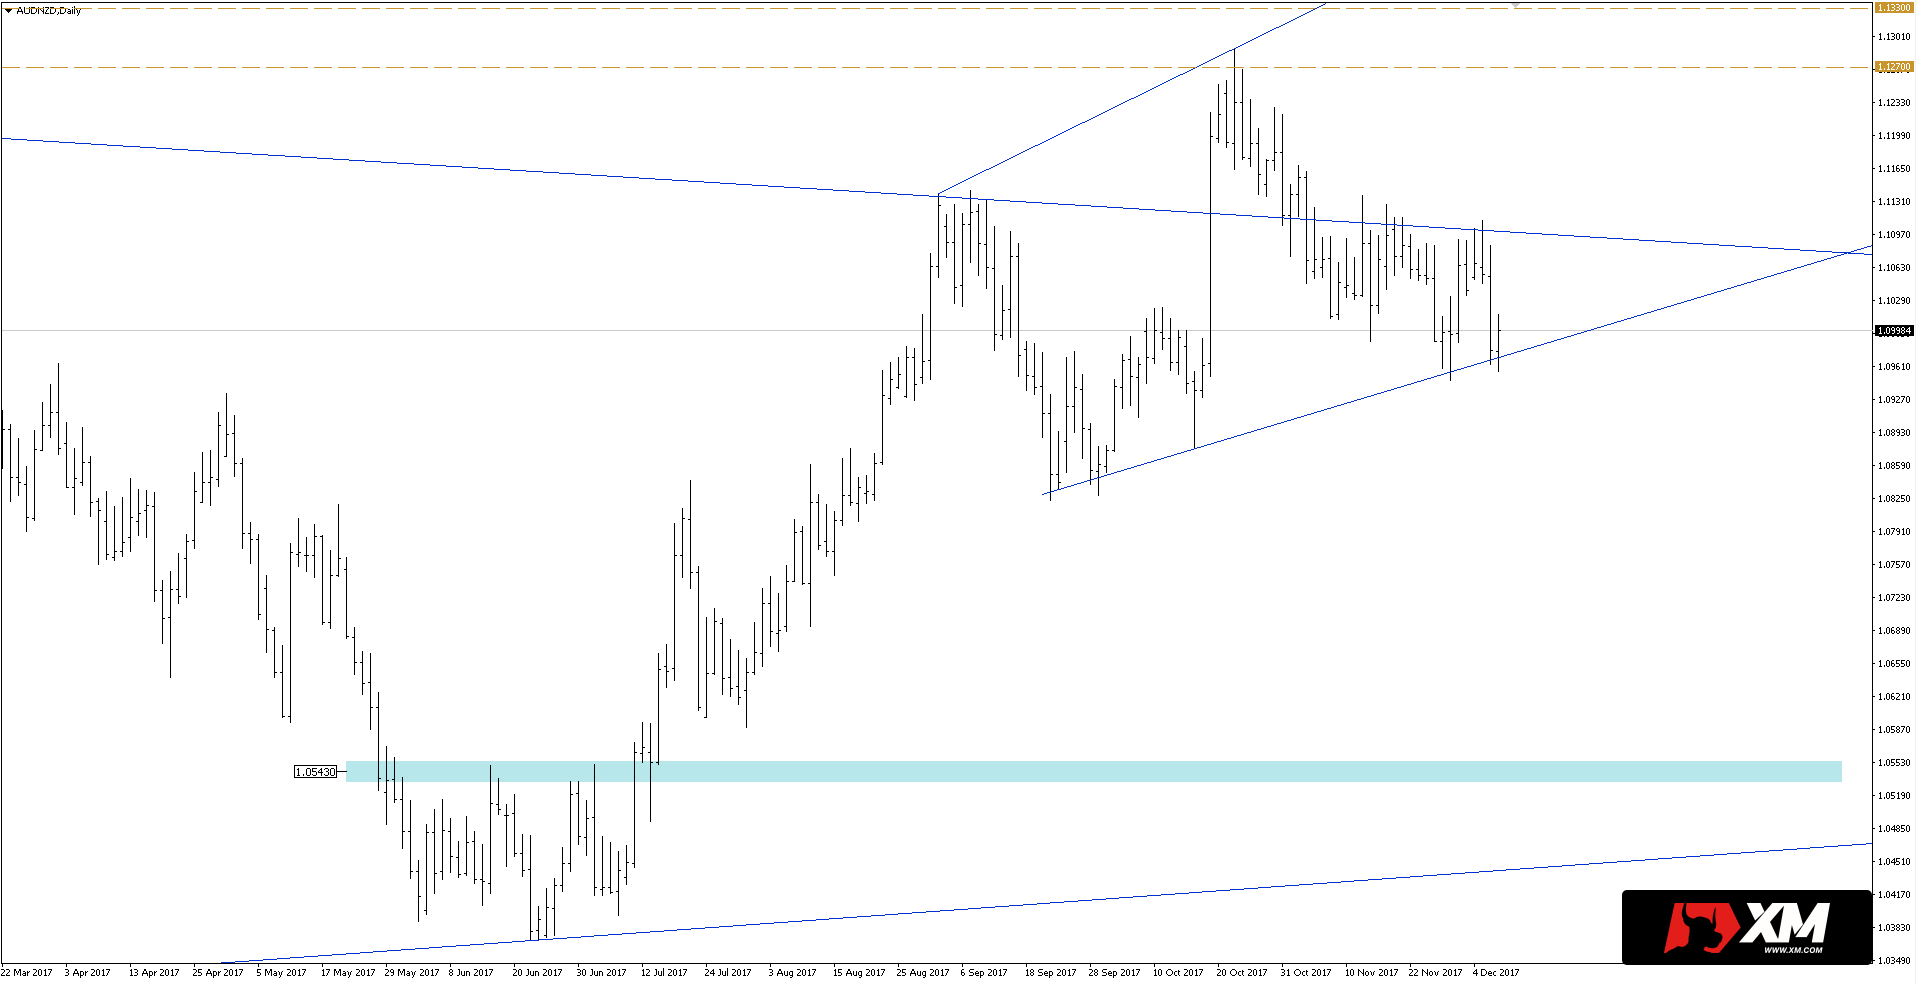
 Everything indicates that the it was a false breakout and the price would return to declines. To find confirmation of such a scenario we need to look on the daily chart. As you can see below, quotes tested diagonal support 5 times from September.
Bulls seem to be getting weaker, while the inflow of offers is expected only after closing the session (effective breakout) under diagonal support and last week’s minimum.
The implementation of the above scenario would open the way to declines towards the area at 1.0543. Alternatively, bearish attitude will be questioned only at the close of the session above 1.1330.
 I recommend to try Price Action at XM broker, which has 5 daily candles and offers 30USD on start to the account without a deposit: LINK


 Review")


