AUDUSD has been in a downward trend for over 18 months, losing nearly 1400p between the maximum of 2018 at 0.8140 and the minimum of this year at 0.6760. For five days we have been observing a correction of the last declines, the first day of this week began with a small upward gap (10p). The daily chart clearly shows that there is an upward divergence between the MACD oscillator and the price.

The potential increases can supported not only by the aforementioned divergence, but also by the content of the text published in the last RBA bulletin (Reserve Bank of Australia). In yesterday’s RBA bulletin there was nothing that contained anything about the launch of QE, in which case we could expect a further weakening of the Australian dollar.
The Bank’s strategy via OMO (open market operations – foreign exchange swaps, repo transactions) was mentioned and was used to maintain sufficient funding and is much more likely to be reused before considering easing QE.
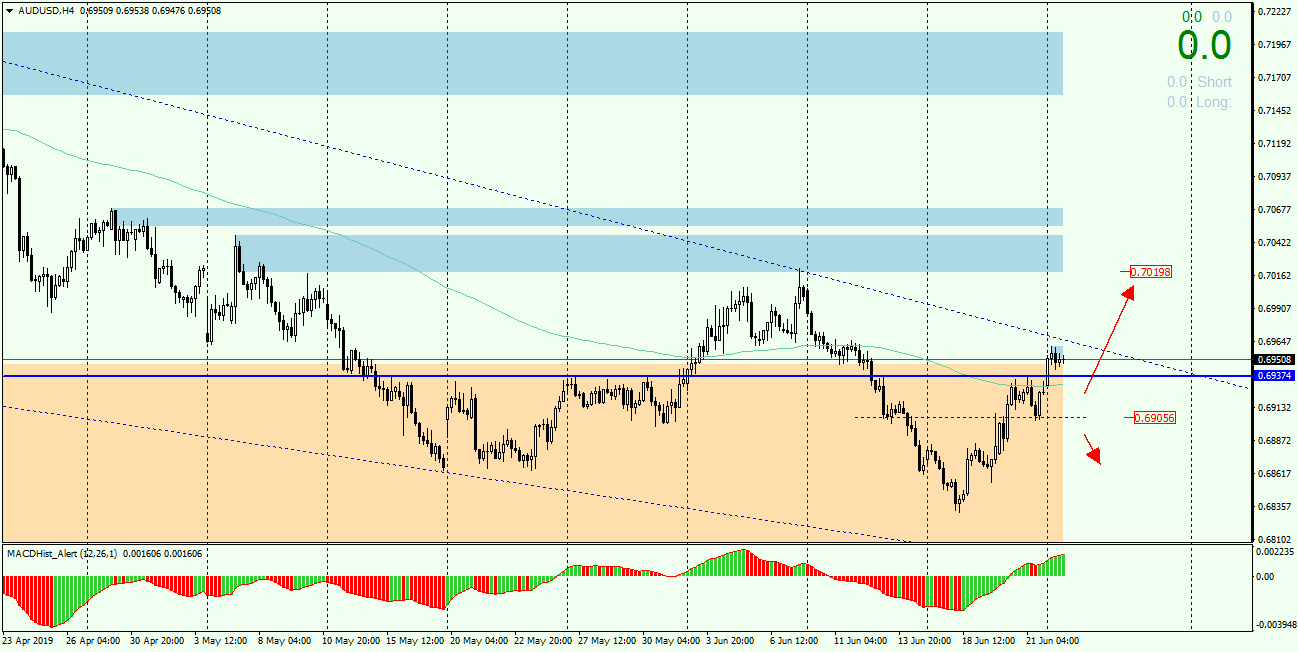
If the price follows the divergence from the daily chart, the demand target can be 0.7000, where the nearest supply zone is located, and SL below S/R 0.6940, or if you play with a smaller volume, you can risk a bigger Stop Loss and place it below 0.6900.
 In our Facebook group, which you can join anytime: https://www.facebook.com/groups/328412937935363/ you will find 5 simple strategies on which my trading is based. There, every day we post fresh analyses of currency pairs and commodities


 Review")


